Category: "Residential Solar"
06/11/15
Categories: All About Solar Power, Commercial Solar, Residential Solar
Roofing reality check. Top 3 considerations for solar
So, you are considering a solar power system for your home or business… and why not, given the myriad of social, environmental and economic benefits! But how do you know if your roof is a good candidate? This is one of the top questions to consider carefully before investing in solar.
 1. Do I have enough space?
The size of your solar system is dependent on your usage needs and the amount you want to offset. However, it is not uncommon to find homes and businesses which are “footprint-constrained” - meaning their system size is limited by the space available.
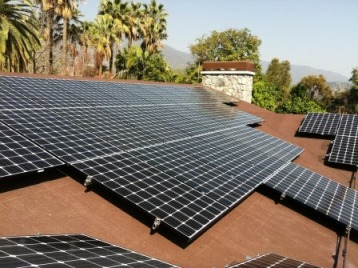
A few things to keep in mind as you look at your roof and ponder how big is big enough… First, while there are many different solar panels they are typically the same size. Run on Sun uses LG panels which are about 65 x 40 inches and can be placed in either a portrait or landscape layout. Panel energy ratings vary, 285-315 watt panels are currently available from LG. For an average home (5 kW) that means you would need around 16-18 panels to offset the bulk of your electricity.
Another limitation is that fire code requires three feet of clear space from all ridges. If you have an irregular shaped roof with many valleys and peaks it may make the layout very challenging. Given that the panels are rectangular and racking is mounted parallel to the roof, rectangular spaces are ideal. However, the 3-foot rule does not apply to uninhabited spaces such as garages and carports making them good options if your home lacks the perfect solar roof.

2. What if my roof is shaded?
Shading from trees, tall buildings, chimneys, or even parapets on flat roofs can significantly degrade the energy output from solar panels. Sometimes all that needs to be done is a generous trimming of that tree that’s gotten a little out of control over the years. Other times it means you really won’t get your money’s worth out of a solar system. But, if the shade elements are few and only during a short time each day, your roof may still be a viable candidate.
If this is the case be sure to talk to your solar contractor about inverters. We have written a great deal about the advantages of “microinverters” in handling shaded roofs, particularly those made by Enphase Energy. “String inverters” on the other hand would be a bad choice as the entire system would degrade when any single panel is shaded.
3. Should I re-roof my house before adding a solar system?
This may be the most important and frequently overlooked question to consider when researching if solar is right for you. Part of what makes solar a great investment is the 25+ year lifetime of the system. But if you have to re-roof during that time there are added costs to remove and re-install the system. If you are planning to re-roof during the lifetime of your solar array be sure you select components, such as the racking system, from companies that…A. will still be around 15-25 years later, and B. will be able to provide compatible replacement parts when pieces are lost during removal and re-installation. Avoid newer companies testing out “state-of-the-art” racking systems and cheap companies banking on the solar boom alone.
For this reason we always ask owners the age of their roof. In southern California, a roof over ten years old should get a makeover before installing solar. If you are unsure of the condition, it is a good idea to have a professional roofer take a look and give you an expert opinion. Sometimes solar contractors can offer this as part of their free assessment. (Run on Sun works with a very reliable roofer who is happy to take a look at any roof in question!) If the roof still has some life left in it but not enough to outlast the solar system you could re-roof only the area where the solar array will cover and plan to do the rest later. An added benefit is that the solar panels will actually protect your roof from the elements, helping it to last longer.
Unfortunately, you will likely be able to find someone willing to put solar on your roof even if it isn’t a good candidate. But if they aren’t discussing the above issues with you, then red flags should be flying! To ensure you get the best investment possible, do your research, take a good long look at your roof, and discuss all of your concerns with your solar contractor.
08/02/13
Categories: Solar Economics, Commercial Solar, Residential Solar, Ranting, 2013
State of SoCal Solar 2013 - Part 1: Methodology & Trends
Today is our first of three posts looking at the state of solar in Southern California for the first half of 2013 as revealed by the data compiled for the California Solar Initiative (CSI). This first post explains our methodology and highlights some interesting trends in the data.
Methodology
Let’s start with our methodology. The CSI collects a significant amount of data as part of managing its rebate program and most, though not all, of that data is made available to the public. For example, while CSI collects data from installers that identify four components of system cost - solar modules, inverters, permitting and everything else - the data that is made available rolls all of that up into just one number - Total Cost. Nevertheless, the CSI data is the most comprehensive data set available and covers all projects being built in the service areas of California’s three investor-owned utilities: PG&E, SCE and SDG&E.
For our analysis, we started with the CSI Working Data set from July 31, 2013. (Here’s a link to the CSI Working Data download page and here’s a link to the data set (11 MB zip file) that we used for this analysis.) This analysis just looks at data from the SCE service area and to limit our time period to just the first half of this year, we added a Status Date field to the data which is the latest of a series of milestone dates recorded in the data (from First Reservation Date to First Completed Date). We then extracted our data for dates from 1/1/2013 to 6/30/2013. After that it is a matter of pivot table magic!
One other note - there are multiple ways to identify the size of a project from the data: Nameplate Rating (i.e., DC Watts), CEC PTC Rating (which accounts for the PTC rating of the solar modules used times the efficiency of the inverters chosen) and CSI Rating (which applies the Design Factor to the CEC PTC Rating and which is the basis for rebate payments. For the most part, unless otherwise noted, we will be using CEC PTC Rating for system size since that accounts for some measure of equipment quality but isn’t confounded by site complications such as shading or the use of tracking systems. In particular, our $/W figures are computed this way.
Trends
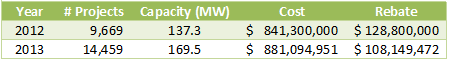
Overall, our data set reflects 14,459 projects, up from 9,669 over the same period last year - an increase of 49.5%.
There are three program divisions in the data: Residential (projects under 10kW), Commercial (projects greater than or equal to 10 kW) and the Multifamily Affordable Solar Housing (MASH). The overwhelming majority of these projects are in the Residential program: 14,028 (97% of the total) are Residential, followed by 387 (2.7%) Commercial and just 44 MASH projects. However, MASH projects are generally associated with affordable housing developments and so they can be quite large overall. In fact, the average MASH project is 158.7 kW, compared to just 5.6 kW for Residential and 216.3 kW for Commercial. Altogether, Commercial projects account for 83.7 MW, followed by 78.8 MW in the Residential program with just 7.0 MW in the MASH program.
Compared to last year, which saw a decline in the amount of solar capacity in the data, capacity this year is up 59% over last year:
At the same time, the average system size continues to decline from 14.2 kW in 2012 to just 11.7 kW this year. Likewise, rebates are falling (by 32%) but so are overall prices (15.2%), just not as fast.
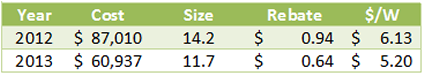
Still, in raw dollars, the reduction in system price of $0.97/W from a year ago, nearly triples the decline in rebate rate.
We will have lots more to say about system costs in subsequent posts.
The pace of projects is accelerating, driven by dramatic growth in the Residential program (as always, click on the chart to see it full size):
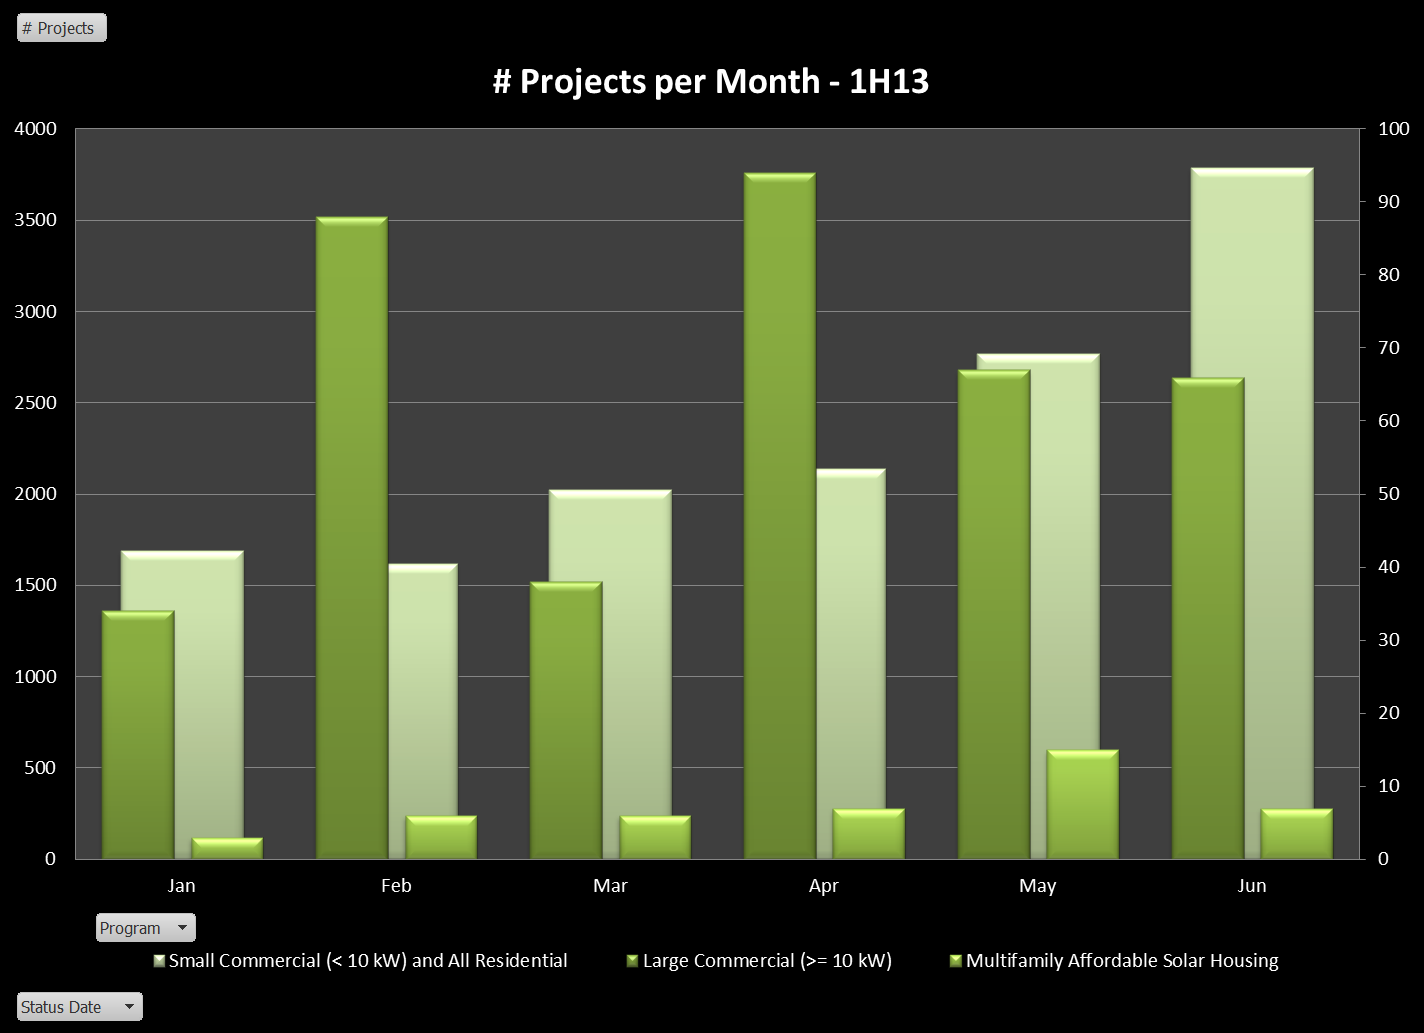 (To make the Commercial and MASH projects visible we have put them on a second axis.) Residential projects have grown from less than 1,700 in January to nearly 3,800 in June!
MASH-Up
Since it is a relatively small slice of the pie we are going to generally ignore the MASH program but before we leave it aside, we thought we should at least take a peak at who are the players in this program. Here’s what we found:
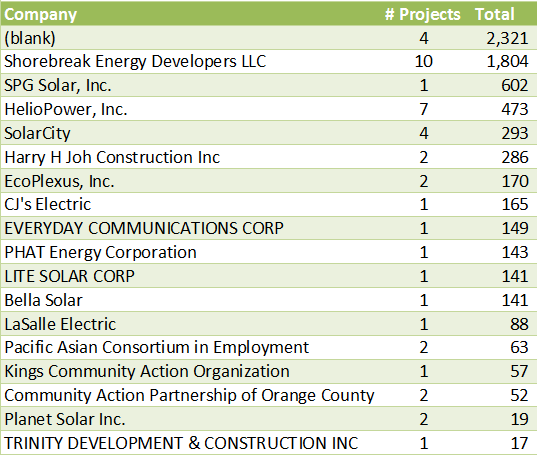
Four projects have no solar contractor associated with them in the data (curious). The big winner, however, is Shorebreak Energy Developers - not a company on our radar, but obviously a major player with nearly 2 MW worth of projects in the program. A few familiar names - HelioPower, SolarCity and even our friends down the road at PHAT Energy (well done, Philippe!).
Roughly half of these projects are third-party owned: 24 of the 44 for a total of 3.5 MW out of a total 6.98 MW. The average cost per CEC PTC Watt is also almost identical, $5.52 for third-party owned versus $5.55 for sold systems. Yet within that average was a very significant range from a high of $13.12 for the 141 kW project being built by Lite Solar, all the way down to $4.32 for the 601 kW project being built by SPG Solar. Shorebreak, the leader in the amount being installed and total number of projects is also a leader on price, coming in at $4.90.
Making the Delist
One stat we continue to find intriguing is the number of delisted projects - projects that got entered into the data but then cancelled at some point. Altogether, there are 471 projects delisted, or just 3.26% of the total, down from 4.2% last year. Those delisted projects accounted for 16.8 MW of capacity or 9.9%, which is up significantly from last year. In other words, fewer projects were delisted, but they accounted for a bigger piece of the potential installed capacity. The majority of the delisted projects, 324 of them (68.8%) were third-party owned.
149 different companies made their way onto the Delist - not surprising for very large players, but as before we decided to look at these companies as a share of their overall project total. We limited to companies with at least 10 delisted projects and then rank ordered them by the percentage of their projects that are delisted. Here they are:
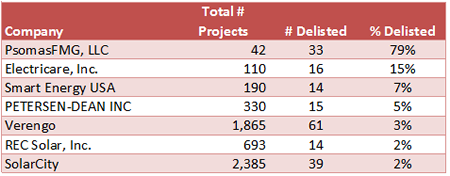 What is up with this? PsomasFMG has 79% of its total projects delisted? Turns out their 33 delisted projects account for nearly half the the total delisted projects by capacity. Not surprisingly, these are all third-party owned Commercial projects ranging in size from 61 kW to just under 1 MW.
The other big winners, Electricare, Smart Energy, and Petersen-Dean had all of their delisted projects in the Residential program with sizes ranging from under 3 kW to just under 10 kW. Interestingly, of the worst actors last year: Remodel USA, Herca Solar and A1 Solar Power, both A1 Solar (4 projects) and Remodel USA (1) still made the delist this go around, but with greatly improved numbers. (Herca Solar has 44 projects overall in the data, none delisted.)
While Commercial projects are necessarily more complex, making cancellations more likely, it is hard to understand a 15% delist rate for Residential projects. Caveat emptor.
Does Size Matter?
Finally, we turn to the question of size, and in particular how well does the size of a project drive down its cost? For this analysis (and most of our analyses going forward) we are excluding delisted and wait list projects from our data. Here’s our result for systems at or below 10 kW:
 As in the past, we had to exclude a couple of outliers above $15/Watt: the farthest out there was Sun Pacific Solar Electric which charged $21/W for a 1.5 kW system and right behind was California Solar who installed a 7.9 kW project for over $16/W! We will have lots more to say about such Outliers next week.
Overall, the trend is clearly moving in the system buyer’s direction with the trend line reaching down to $5.40/W for systems sized at 10 kW, while a typical residential project of 5 kW comes in around $5.70/W.
Nevertheless, that is a very gradual slope indicating that prices are fairly consistent across system sizes in this program segment.
What about larger systems, do we see more of a downward trend there as system sizes increase? Here’s the data:
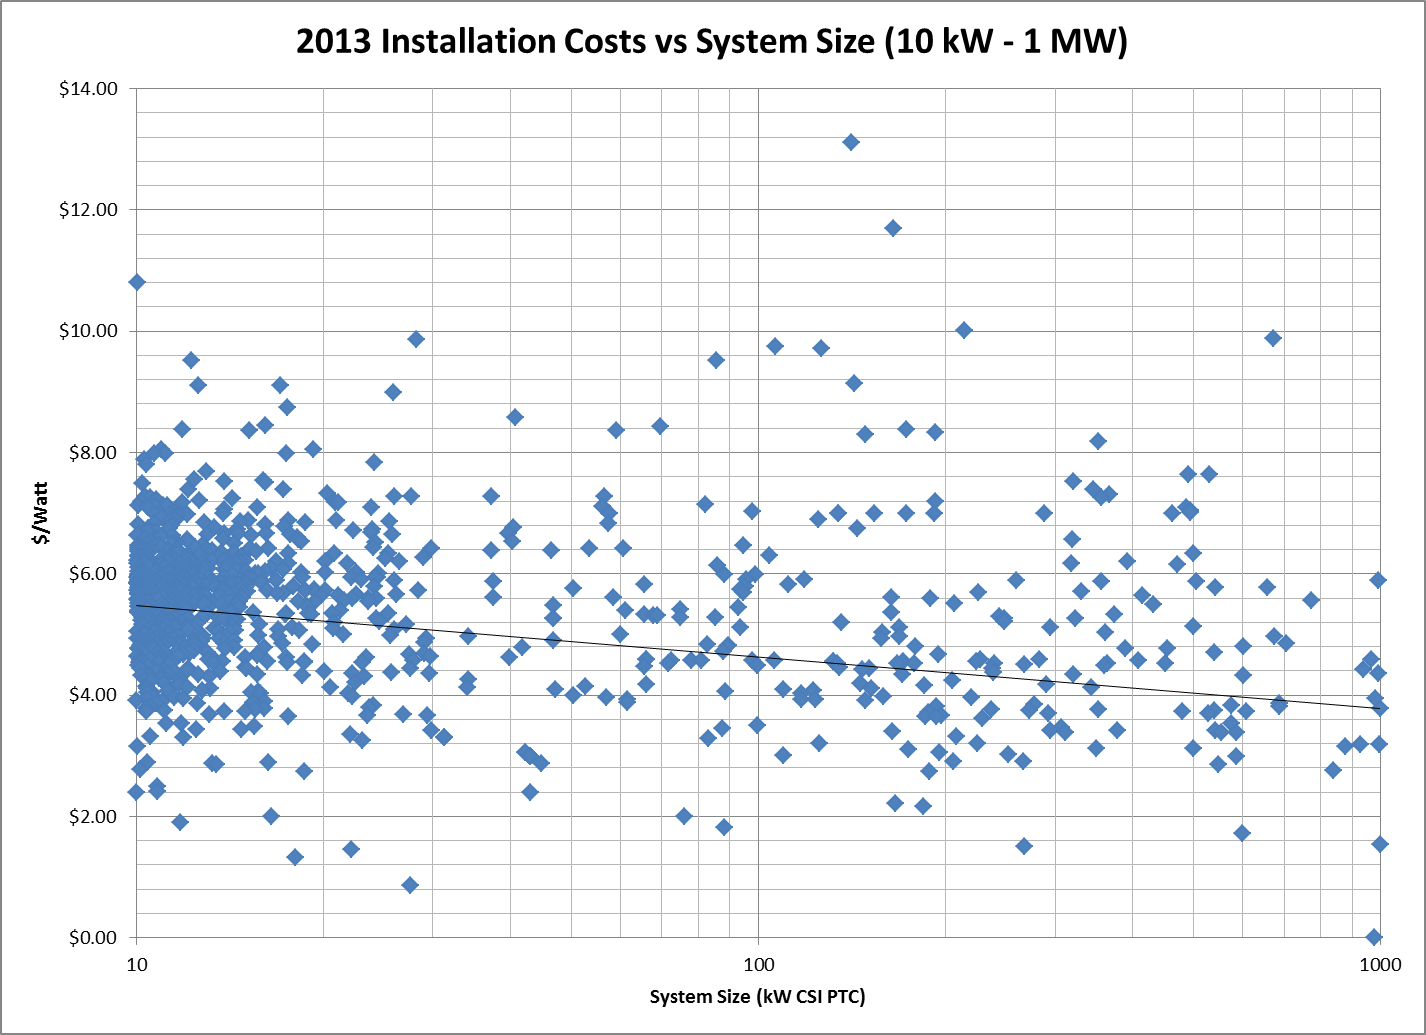 Interestingly, for the smaller projects there is very tight clustering right around the $5.70 mark where the trend line begins. However, as you move up in system size, the clustering breaks down and system costs vary far more widely than they do for smaller systems. Still the trend has 1 MW projects coming in around $3.77/W, compared to nearly $5.20 last year.
Ok, that’s enough to get us started. Monday we will report on Who’s Hot and Who’s Not, and Tuesday will be our favorite post: Outliers and Oddities. Stay tuned!
04/10/13
Categories: Solar News, SCE/CSI Rebates, SCE, NABCEP, Commercial Solar, Residential Solar, SDG&E
Picking a Commercial Solar Contractor: NICELY Does It!
Before you can ever get a bid for your commercial solar project, you have to contact a solar installation contractor to come out to your location and perform a site evaluation. Actually, you should contact at least three contractors so that you have a set of bids to compare (more on that process below) - but how do you find them in the first place? Well, you could choose based on who has the most ads on TV or the Internet, or you could rely on Cousin Billy’s recommendation - but somehow that just doesn’t seem sufficiently scientific for a project like this. There has to be a better way - and there is.
If you remember that you need to find someone who will work NICELY with you, success is all but assured. And no, we don’t mean nicely, we mean NICELY - as in:
N - NABCEP Certification
I - Incentive provider (CSI or local utility) connected
C - City building department experienced
E - Electrician on staff
L - Local or national?
Y - Years in business.
Focus on those attributes and you will have found a contractor who will inspire confidence and guarantee a successful project. Let’s expand on why these particular attributes are so important.
NABCEP Certification
 The North American Board of Certified Energy Practitioners - NABCEP for short - provides the most rigorous certification process of solar installation professionals in the industry. Not to be confused with their Entry Level Letter that merely demonstrates that the person has taken an introductory course in solar, the NABCEP Certified Solar PV Installer™ credential is the Gold Standard for installers and consumers alike. Earning NABCEP Certification requires the successful candidate to have an educational background in electrical engineering or related technical areas (such as an IBEW union apprenticeship program), at least two solar installations as the lead installer, and the successful passing of a 4-hour written examination on all aspects of solar power system design and installation.
As NABCEP notes:
When you hire a contractor with NABCEP Certified Installers leading the crew, you can be confident that you are getting the job done by solar professionals who have the “know-how” that you need. They are part of a select group of people who have distinguished themselves by being awarded NABCEP Certified Installer credentials.
NABCEP’s website offers a database of all Certified Solar PV Installers - just enter your zip code to find the installers located near you. It is with great pride that we point out that at Run on Sun, all three of our owners have earned the designation, NABCEP Certified Solar PV Installer™ - and we know of no other solar power company in Southern California that can make that claim.
Incentive Provider - CSI or Local Utility
A second source of solar installers is the Incentive provider such as the California Solar Initiatives’ Go Solar California website. Every installer who has done a solar power installation for a CSI utility (i.e., SCE, PG&E or SDG&E) will be included on this list. Unfortunately, there are no other criteria associated with getting listed - and there is limited verification done to guarantee that the listed installer is reliable. If your job is in California, your contractor must be on this list - but this is a double-check only - not an ideal starting point for your search.
Another source for information about solar installers is your local utility’s point person for solar rebates. This person deals with installers on a daily basis, and while s/he won’t give you a specific recommendation, they may be able to warn you off of an installer whom they have learned is less than reliable.
City Building Department
Similarly, the folks in your local building department deal with installers regularly as part of the permitting/inspection process. Once again, they won’t be in a position to provide referrals, but they may be able to give you a warning if there are red flags associated with a contractor that you are considering.
Local or National?
Solar installation companies come in all sizes - from national organizations that have crews installing systems all across the country, to local operations that only work in a limited geographic region. To be sure, there are pluses and minuses on both ends — maybe lower prices for the national chain due to economy of scale in their purchasing versus greater attention to detail from a local company that lives or dies based on how well it satisfies its local customer base. And, of course, money spent on a local company tends to stay in the local economy - another consideration in tough economic times.
Years in Business
The last of the NICELY elements is to look at the number of years the company has been in business. Again, this is not a perfect indicator – some recent ventures really have their act together and some long-standing enterprises have long since ceased to really care about what they are doing – but at a minimum you want some assurance that the folks you are doing business with know how to run a business. Otherwise you run the risk of having a largely useless warranty and no one to call if things go wrong.
We would recommend a minimum of three-to-five years in the business of doing solar, with preferably a longer track record of running a business. Expertise in areas beyond just installing solar is also useful such as engineering, management and law.
The preceding is an excerpt from Jim Jenal’s upcoming book, “Commercial Solar Step-by-Step,” due out in July.
09/06/12
Categories: All About Solar Power, Residential Solar, Ranting, 2012
Outliers & Oddities - State of SoCal Solar 2012 - Part 3
This is it - time to name names and find out which solar companies are the good, the bad, and - if not ugly, at least Outliers and Oddities!
In Part 1 of this series we laid out our data methodology and showed some of the general trends in the costs of solar power systems in Southern California Edison (SCE) territory for the first half of this year. Part 2 built on that to determine Who was Hot and Who was Not - and of course, being identified as Not Hot is certain to generate a lot more consternation than the other way around!
Now in Part 3 we turn our attention to some curious things that we have found in the data: Outliers who are charging way beyond any reasonable amount compared to their peers, or taking interminably long to complete projects, and Oddities - curious trends that defy easy explanations but raise questions about the State of Solar in Southern California.
Outliers
Last year when we analyzed this data, we discovered that there was one company that really stood out for being a bad actor when it came to over-charging on solar power systems. That company was Galkos Construction, coming in at a staggering $13.32/Watt compared to an average of $8.91/Watt, nearly 50% above the average. (We also noted that HelioPower, Inc. was the lowest in our analysis, coming in at just $6.56/Watt or 27% below the average.) What will we discover in this year’s data?
First a reminder of how this analysis works. Our focus is on systems in the residential market segment since that is the bulk of sales and also where consumers are at greater risk of being pressured into a high-priced sale. (If you are installing a 500kW solar farm and you don’t do your homework, we have somewhat less sympathy for your plight.) Moreover, since the residential segment in the CSI data is limited to systems between 1 and 10kW, there is not as much size difference to skew the pricing data. We excluded systems that were “delisted” so only completed or pending projects are counted. We included, as we did last year, both cash sales and leased systems (although that data has gotten more interesting as we will see later) to capture as many data points as possible. That subset of our data accounts for 8,977 systems with an average system price of $7.23/Watt (CSI Rating).
Finally, since we really only wanted to look at the behavior of the biggest players, we limited our analysis to only those companies with over 500kW of residential projects in the data. As a result, no company had fewer than 80 projects on our list, and the largest had nearly 1,800! These are big players indeed, and they should be able to demand tremendous pricing for their components - but do they pass those savings on to their customers? When we apply this restriction to the data, our sample size is reduced to 6,095 systems (68%) with an average system price of $7.38/Watt - roughly 2% higher than the overall average! Here are our results:
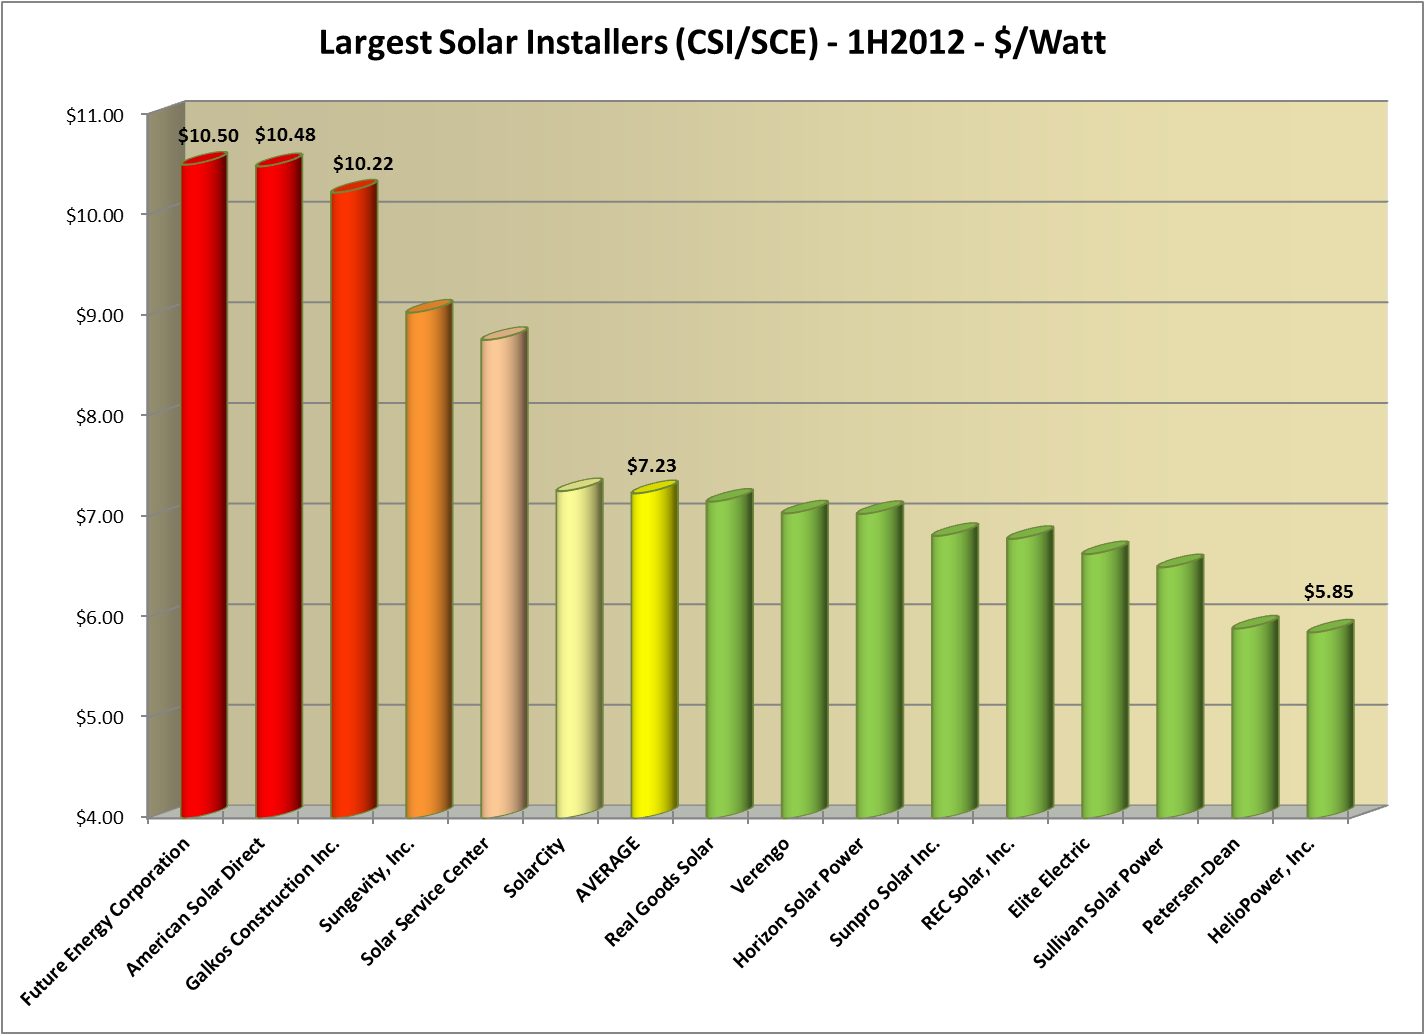 The bulk of our companies here, 9 out of 15, come in below the overall average for this group. And once again, our friends over at HelioPower came in with the lowest system price at just $5.85/Watt. Nicely done, for the second year in a row! (Full disclosure - while none of our projects were in SCE territory during this period, our system price for the first half of 2012 was just $5.33/Watt.)
True Outliers: Future Energy, American Solar Direct and Galkos Construction (Again!)
While down significantly from the stratospheric heights of last year, three companies continue to soar past the $10/Watt threshold: Future Energy Corporation, American Solar Direct, and just like last year, Galkos Construction, Inc. Each of these companies is $3/Watt above the average for the residential market segment. To what can we attribute these crazy prices? Future Energy and Galkos use Enphase micro-inverters (but so do we, and our prices are approximately 1/2 of theirs) and in any event, American Solar Direct uses SMA exclusively, so inverter price is not driving these costs. What about panel choices? No insight there, either: Future Energy uses SunPower, but American Solar Direct uses REC and Galkos uses Sharp (and each uses that brand over 90% of the time). And they each bought a lot of panels: Future Energy bought 3,091, American Solar Direct bought 6,329 and Galkos bought 7,759. Surely that much purchasing power can demand tremendous cost reductions to these companies. Equipment choices are simply not driving these prices.
Cost Caps?
The CSI program has talked about cost caps for a long time, and in the latest published CSI Handbook (from December 2011) we find this provision:
3.4.5 Limitations on Installed Cost
One of the goals of the CSI program is to support a reduction in PV system costs over time as defined by:
Total Project Cost ($)CEC-AC (Watts) = $/Watt
It is the intent of this program to make steps towards this goal. Projects applying and installing PV systems through this program should have their installed cost fall within a reasonable limit. The current average system cost of PV systems ranges from $7.36 to $8.41 per CEC-AC watt, fully installed. To ensure that the integrity of the program is maintained, the Program Administrators may require documentation for why system costs exceed the lower of either of the following:
- $10.26/Watt; and/or
- One standard deviations above the average cost per watt of all projects reaching Pending Payment Status within the last 12 months, whichever is less. (NOTE: As of 8/31/2011, the defined reasonable limit was $10.26 CEC-AC watt, but this value changes as costs decrease. The current limit is available at www.CaliforniaSolarStatistics.ca.gov)
Now this cost calculation is somewhere between the number we are using (which includes the design factor) and the nameplate cost (which is what solar companies typically report because it is the lowest and it also masks differences in equipment value). What would happen if we were to re-jigger our cost values for our three Outliers to present their system costs as defined by the CSI Handbook’s Cost Cap section? Here are the results:
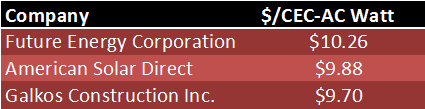
What do you know about that? Future Energy’s average price is exactly at the limit stated in the CSI Handbook to avoid scrutiny by the Program Administrator! What a coincidence! To be sure, all three of these companies exceeded the $10.26 threshold: Future Energy (99 out of 171 times, 58%), American Solar Direct (68 out of 291, 23%), and Galkos (170 out of 482, 35%).
What to make of that? For one thing, it shows that Cost Caps work - despite being dollars above the average cost of their peers, they each managed to at least have their average value remain under the cap. For another, perhaps it would be useful if CSI published those companies that routinely exceed the Cost Cap in a given period? If nothing else, it would help put consumers on notice in ways that they presently are not (unless, of course, they are reading this blog).
We would love to hear from Future Energy, American Solar Direct or Galkos, and we will be happy to print their explanations for these prices unedited, and in full. (Of course, those responses are subject to further analysis.)
Not So Fast
Another type of outlier is the large solar company who signs a contract and then disappears for months on end while the customer waits, and waits, and waits (cue the Casablanca soundtrack). For our same set of big time players, we decided to rank order them by the average time to go from the first filing of a rebate reservation request to the first completion date. While there are lots of reasons for any one project to get delayed, for companies like these that install such a huge percentage of all systems, you would expect to see quick and efficient operations that deliver quality systems in short order. Here is what we found:
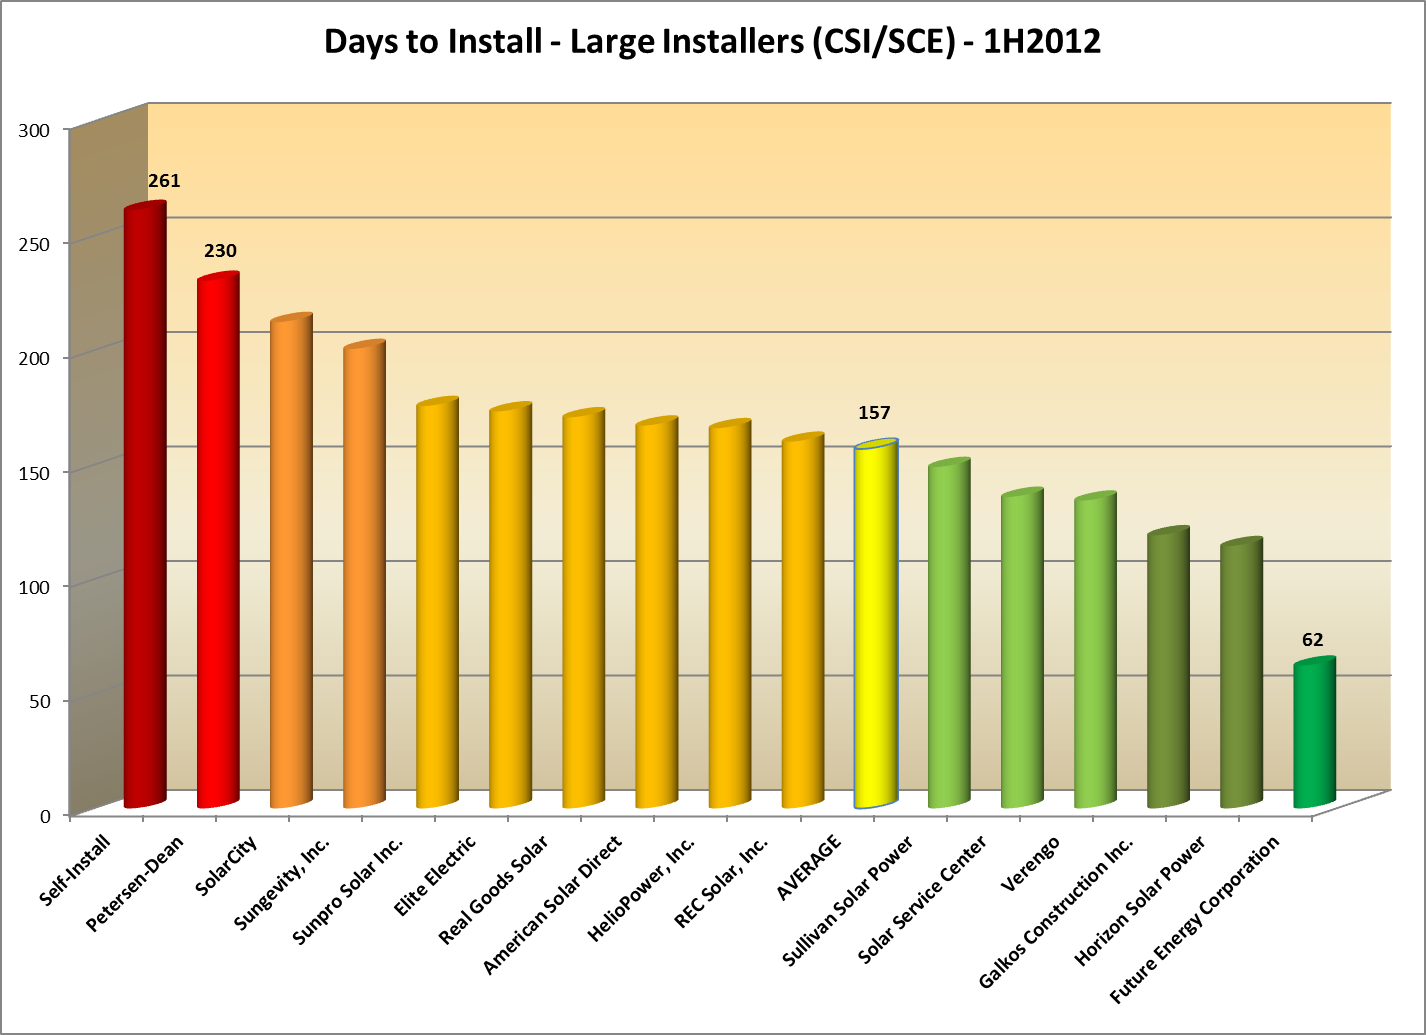
(Wow - Do-it-Yourself’ers take the longest to get their systems built - who would have guessed? Yet another reason why solar is not a DIY project!)
Now isn’t this interesting - Future Energy has the shortest time to install of all of these companies, taking roughly half the time to complete a project as its nearest competitor. Maybe Future Energy customers are getting something for all of that extra money! (Although a little research might reveal some cheaper, faster options…)
The average - which most of these companies cluster closely around - is still in excess of five months, far longer than most solar customers expect to wait. But two companies - Petersen-Dean and SolarCity - have delays in excess of 7 months! Perhaps being a huge company, like SolarCity, makes it harder to be responsive, but what is Petersen-Dean’s excuse? They have 257 systems in this sample (compared to the 1,108 for SolarCity), not that many more than the 171 of our speediest company, Future Energy, and nowhere near the number of systems for Verengo which is actually doing better than the overall average at a delay of 134 days.
This got us to thinking - if we take the average number of days to complete as our benchmark, some companies will be working better and some worse than that average. In other words, some companies are insuring that solar systems are installed faster, whereas others are, sadly, causing systems to be installed slower. What is their cumulative impact?
To measure that, we came up with a new metric which we have dubbed the cumulative System-Years of Delay, or SYD (see Notes at end), which is the product of the total number of systems attributed to a company times the difference between the overall average time to complete and the time for this company, divided by 365. Companies that install faster than average under this metric will have a positive value, slower companies will be negative - thus the goal will be to have the largest value possible. Think of this as whether a company is propelling the overall solar industry forward, or dragging it backward. Here are our results (companies clustered around the average have been deleted for clarity):
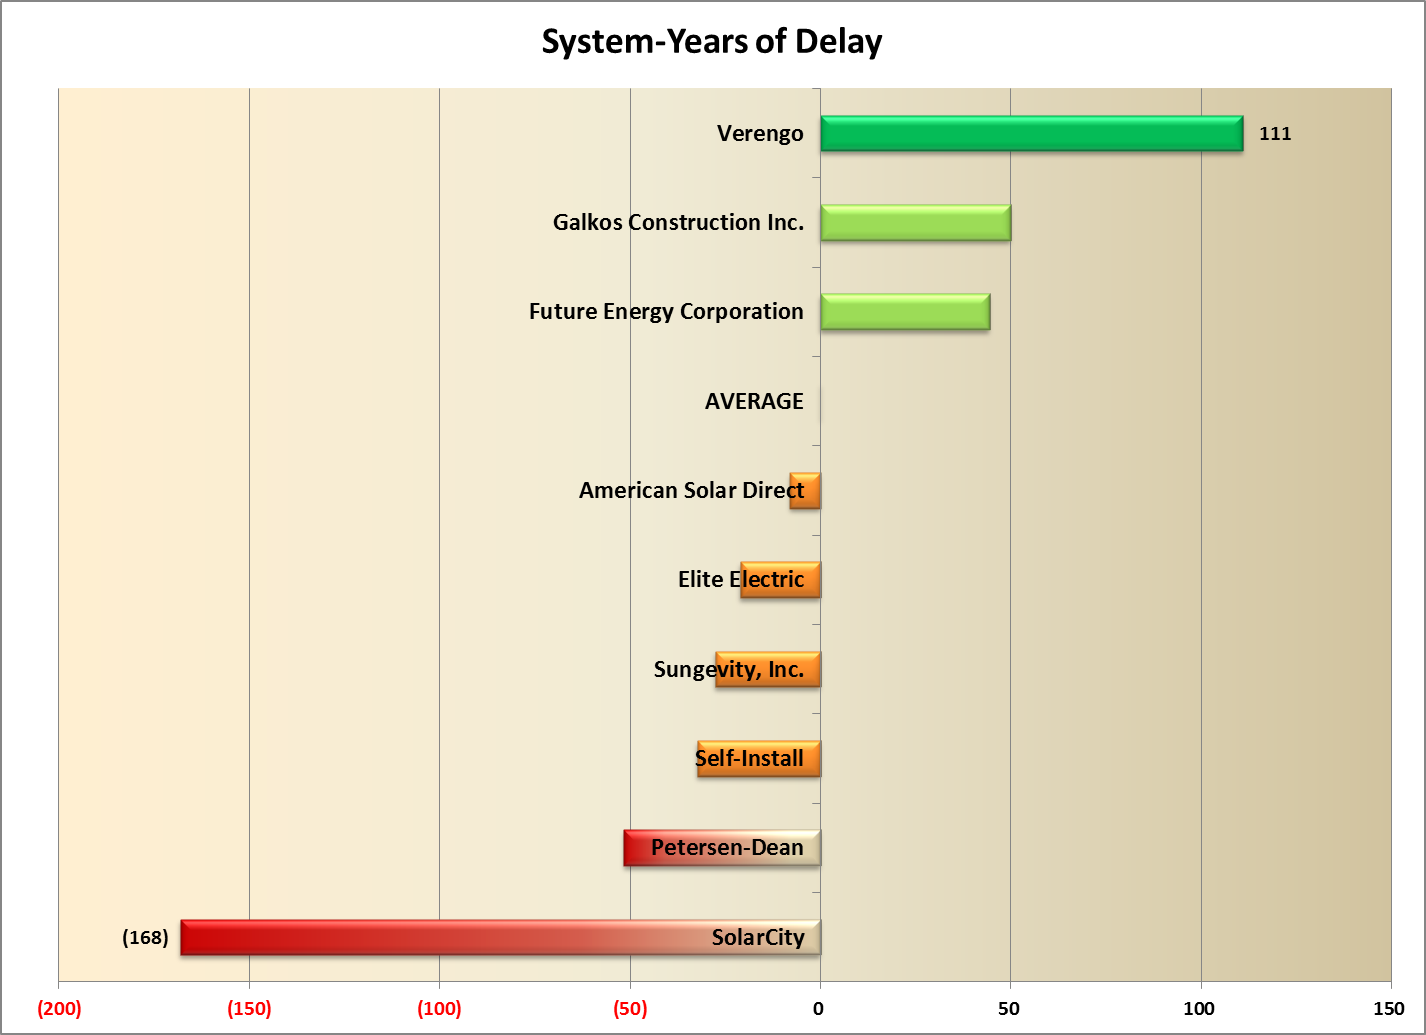 This is a startling result - the two giants of the industry, Verengo and SolarCity, are at opposite ends of this scale! Verengo, which has 1,791 systems in this subset, averaged 134 days to complete a project, 23 days better than the average for our major players. Thus, it is propelling the installation of solar forward since it handles so many systems faster than average. (Future Energy is way faster still, but has a small impact by comparison because it only installs a tiny fraction of the systems Verengo is handling.) To be sure, Verengo’s 134 days is nothing to brag about, but in this crowd of relative slow-pokes, Verengo is clearly leading the way.
So what can we say about SolarCity? Well, first, they are really slow - taking on average nearly two months (55 days) more than the overall average (of five months) to get a system installed. (As with the fastest company comparison, Petersen-Dean takes substantially longer than SolarCity - 73 days worse than average compared to 55 - but they account for far fewer systems - 257 versus 1,108.) But more importantly, SolarCity’s delays become a real setback for the overall industry given the large number of systems for which they are responsible.
Look at it this way: SolarCity, just in this tiny slice of data, representing just a fraction of their overall industry impact, is responsible for the installation of 1,108 systems representing a total capacity of 5.5 MW of residential solar. Assuming an average of 5 solar hours per day, for every day that SolarCity delays installing these systems, 27.5 MWh of energy is not being produced. Factoring in their 55 day delay beyond the average of their peers means that 1.5 GWh of energy was not produced, and instead, 498 additional tons of greenhouse gases were emitted (see Notes at end). SolarCity’s delays are bad for the solar industry, and bad for the environment.
Oddities
Which brings us to the Oddities section of this post. One year ago we stirred a bit of controversy by observing that SolarCity’s system prices for leased systems were far higher than what they reported for cash sales. We thought this was odd because there was no similar discrepancy in the data for the other large player in the leasing space, Verengo. So naturally, we needed to revisit that analysis this year and see if that trend was continuing.
Our analysis last year tried to focus on the most recent projects in the data, and so restricted the data set to just include “pending” systems, eliminating those that were installed or delisted. Last year, SolarCity charged $10.06/Watt for its 468 leased systems compared to Verengo which only charged $7.63/Watt for its 482 leased systems.
Here’s what this year’s data reveals:

First some mundane observations: while Verengo has increased its number of pending systems from a year ago by roughly 45% (consistent with the overall growth in this data set from a year ago), SolarCity actually declined by roughly 24% and Verengo now has nearly twice the share of this segment as does SolarCity.
But of course the shocking data point is SolarCity’s cost per Watt - all the way down to $6.61, and now tied (exactly) with Verengo! This is a remarkable development given that the overall downward trend in prices over the past year was far, far more modest than the precipitous drop reported by SolarCity.
We decided to investigate this a bit further. In particular, if the decline in SolarCity’s pricing was simply that they were better able than most to take advantage of lower equipment prices, we would expect to see a gradual decrease over time from last year’s high to this year’s low. To test that hypothesis, we went back to the overall data set and expanded our analysis to look at all California data (i.e., including PG&E and SDG&E data in our analysis). In addition, because we needed to go back to 2011 data, we included completed projects (i.e., “installed” in the data) as well as pending projects. We then aggregated them by month and calculated the month-by-month average system cost from January 2011 to June of 2012. Here’s what the data disclosed:
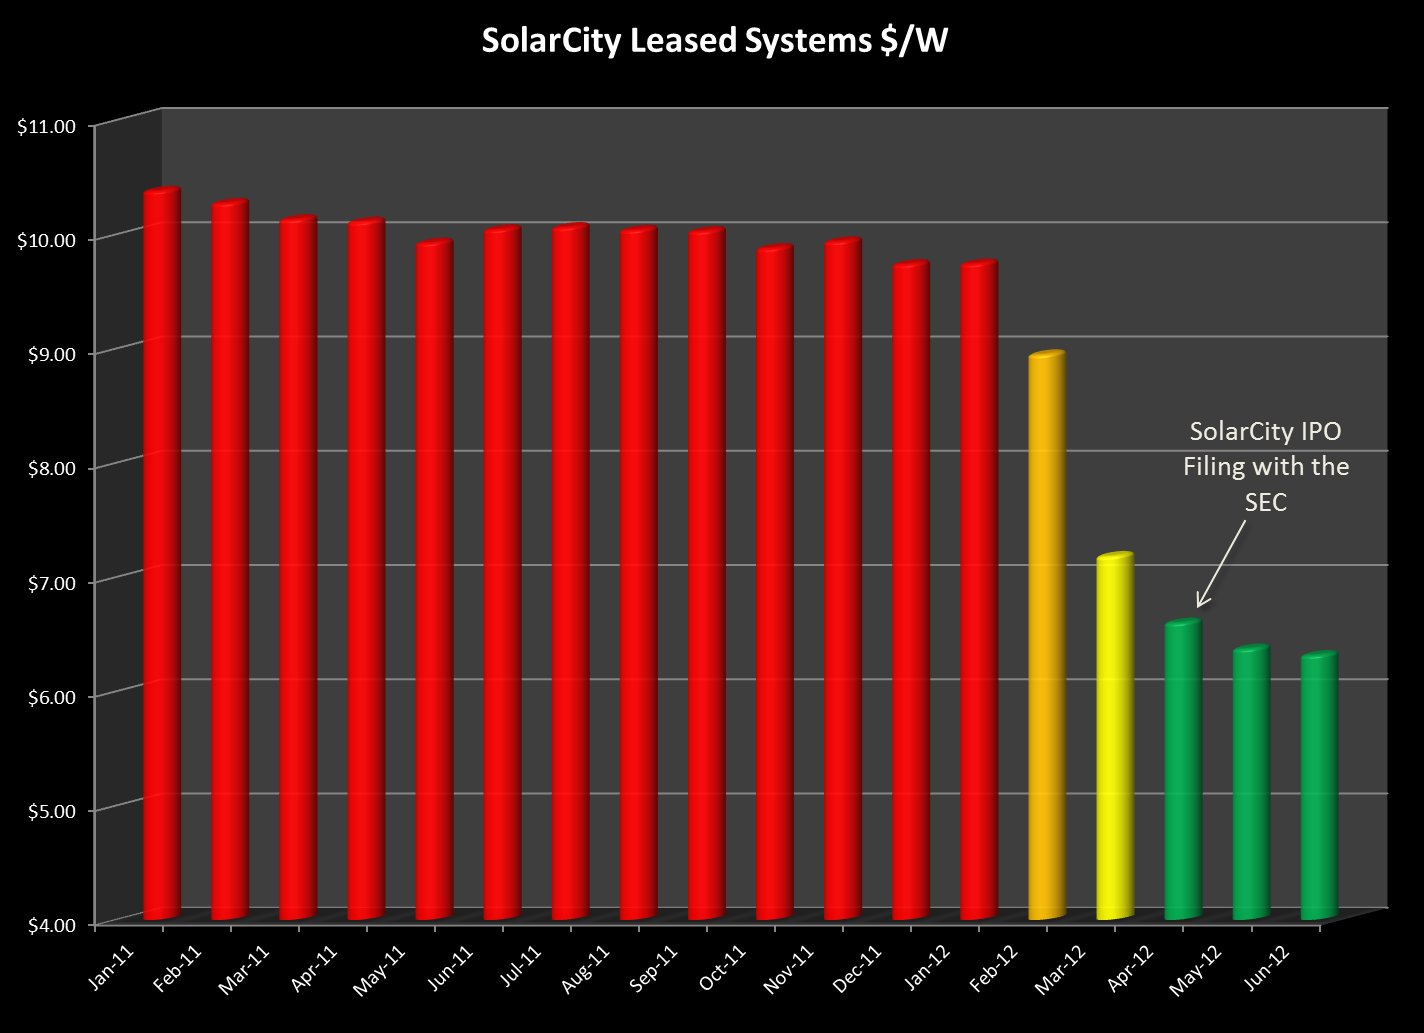 For thirteen months, from January 2011 through January 2012, SolarCity’s system costs were remarkably stable - at or near $10/Watt. But then something amazing happened and in the space of three short months, SolarCity slashed its prices from $9.74/Watt in January to just $6.60/Watt in April - a drop of more than a dollar a Watt per month! Now our buying power is nothing compared to that of SolarCity, but we certainly didn’t see price declines anything like that!
And then we remembered something else that happened back in late Winter and early Spring (although the memory is a little fuzzy given that we haven’t heard anything more about it since). From Bloomberg.com (April 9, 2012):
Elon Musk, who leads Tesla Motors Inc. (TSLA), said an initial public offering of SolarCity Corp. may occur this year after a review of accounting, with an IPO of Space Exploration Technologies Corp. probable in 2013.
Plans to sell shares in SolarCity, which leases rooftop solar-power systems, won’t advance until “additional clarity on the accounting” for those leases is provided by auditors and the U.S. Securities and Exchange Commission, Musk said in an April 5 interview. Bloomberg reported Feb. 1 that the San Mateo, California-based company was seeking an IPO as early as last month, citing three people with knowledge of the matter.
“There is this question of how do you account for something when it’s a lease,” Musk said. “Not all of them are structured in the same way. We want to just double-check with our auditors and the SEC before we file to make sure the accounting is correct.”
Rumor has it that the SolarCity IPO may have stalled over concerns by the SEC regarding those very accounting practices. If the need to “clarify” its accounting - specifically the manner in which it calculates the fair market value of its leased systems - is what is driving down this pricing it begs the question: Will SolarCity voluntarily revisit the accounting for all of its previously leased systems and refund the excess federal tax credits and depreciation that it has received based on what its present conduct seems to concede was an overstated valuation? Time will tell.
System-Years Delay
The SYD formula in full looks like this:
![]()
Where CountX is the number of systems installed by Company X, AvgInstallDays is the overall average for this group of companies (157 days) and InstallDaysX represents the average number of days to complete an installation for Company X.
SolarCity’s Excess GHG Emissions
Excess greenhouse gas emissions attributable to SolarCity’s delay was calculated as follows: We used the EPA’s eGrid Calculator to estimate the GHG emissions from SCE’s energy production. That figure comes to 659.6 lbs/MWh. We calculated in the article that SolarCity’s delay accounted for 1.5GWh (1.512 GWh to be precise, or 1,512 MWh) of energy not produced by those solar systems during the delay period. That works out to 997,315 lbs of GHG or 498 tons.
08/29/12
Categories: Commercial Solar, Residential Solar, Ranting, 2012
Who's Hot and Who's Not?
The State of SoCal Solar - Part 2
In the highly competitive solar marketplace, some companies are thriving while others are withering on the vine. It’s the age old question: Who’s Hot and Who’s Not? In Part 2 of our series on the State of SoCal Solar, we will answer that question, and more!
In Part 1 of this Series we explained our methodology and looked at some overall trends in the data. To identify the players in the SoCal solar marketplace, we extracted the solar panel and inverter data from our CSI data set. (Unfortunately, the CSI data does not include any information regarding racking equipment used on a project.) While the CSI data allows for multiple different panels and inverters to be identified with each project, in reality the overwhelming majority of projects report only one panel or inverter choice. As a result, we will continue our practice from last year and only look at the first choice reported for both solar panels and inverters.
Top Solar Panels
There are two statistics that are meaningful - the total number of panels utilized and the number of projects on which those panels were employed. We excluded “delisted” projects from our analysis and we will further divide the universe of projects by residential or commercial.
Residential Trends
In the residential space, there are 97 different panel manufacturers listed, but only 15 of them accounted for more than 1% of the total sales volume of 228,372 panels.
Here are our results for the residential market:
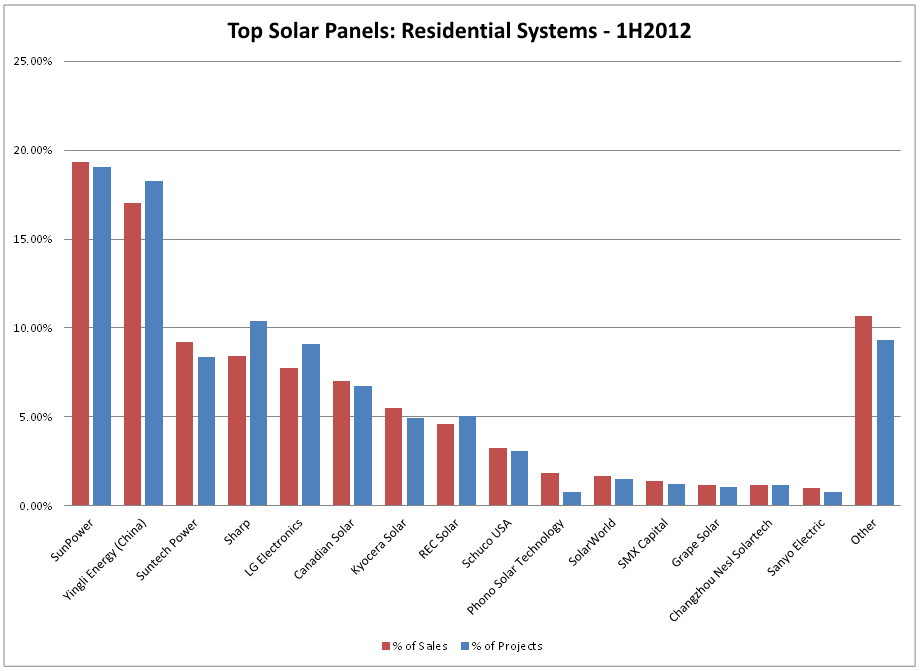 From this analysis it is clear that SunPower and Yingli rule the residential marketplace, combining for 37% of all sales and a comparable share of all projects. New kid on the block, South Korea’s LG Electronics, has jumped out to a very strong start, coming in fifth place behind venerable contenders, Suntech Power and Sharp. Also notable is that Sanyo - a long-time leader thanks to its great efficiency and thermal properties - has nearly fallen off this chart altogether. (Sanyo accounted for just barely 1% of total sales on just 0.8% of all projects.)
Those are the results for the residential market overall, but does it make a difference if you distinguish leased projects from cash purchase? Indeed it does, with only three companies having more than 5% market share in both market segments: SunPower (22.8% purchased, 18% leased), Sharp (16% and 5.3%) and Canadian Solar (9.5% and 6%). LG Electronics sold almost all of its product into the leased systems segment with a market share of 10.7% compared to less than one-half a percent in the purchased segment. Altogether, the purchased market segment accounted for 65,841 panels sold whereas the leased segment dwarfed its older sister with 162,531 panels sold.
The top-five most popular residential solar panel models were: Yingli YL235P (21,098 units), LG Electronics 255S1C (15,970), SunPower 327NE (12,273), Suntech Power 190S (11,488) and SunPower 230E (9,069).
Commercial Trends
On the commercial side, there are 60 manufacturers listed, of which only 13 accounted for more than 1% of the total sales volume of 350,360 panels. Here are our results from the commercial side:
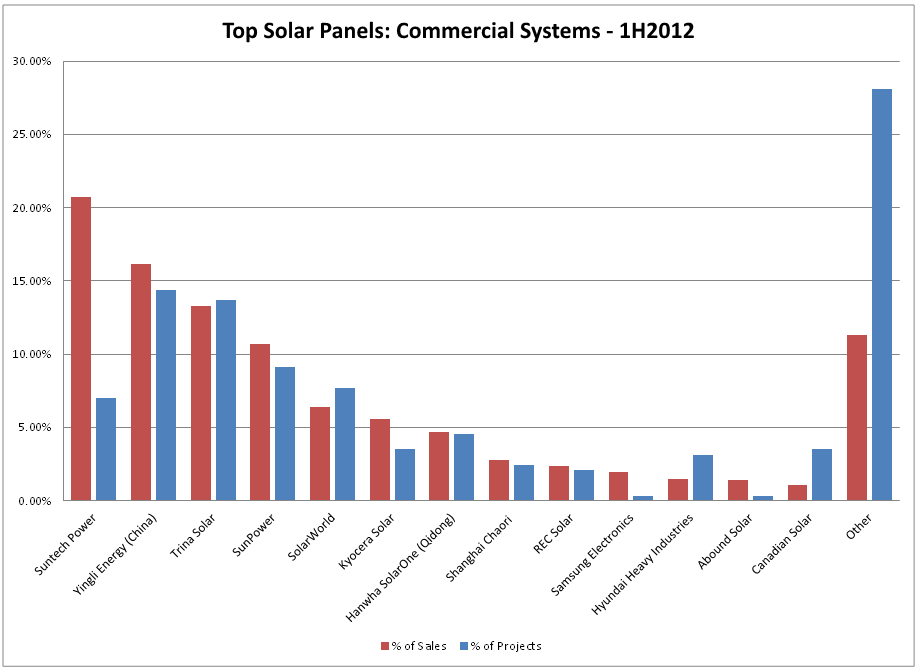 Suntech has taken over from SunPower the top spot in the rankings, accounting for nearly 21% of the panels installed and it did it with only 7% of the total projects. In contrast, second place finisher, Yingli, had more than twice as many projects - 14.4% of the total - but its market share was only 16.2%. While this select group were the only manufacturers to crack 1% of sales, the remaining manufacturers captured a whopping 28% of all projects.
The top-five most popular commercial solar panel models were: Yingli 230P (43,064 units), Suntech Power 280-24/Vd and /Vb-1 (65,475 - two variants), SunPower 327NE, Trina Solar 230PA05 (21,590) and Trina Solar 225PA05 (17,950).
Top Inverter Manufacturers
Analyzing inverter sales is a bit different since many projects have more than one inverter, and in the case of micro-inverters installations, there is one inverter for each solar panel. For our analysis, we will just look at the number of projects with the manufacturer’s product listed as inverter number one.
Residential Trends
The CSI data reveals 24 different inverter manufacturers in the residential space, but only 8 of them cracked the 1% market share threshold. Here are our results for the residential market:
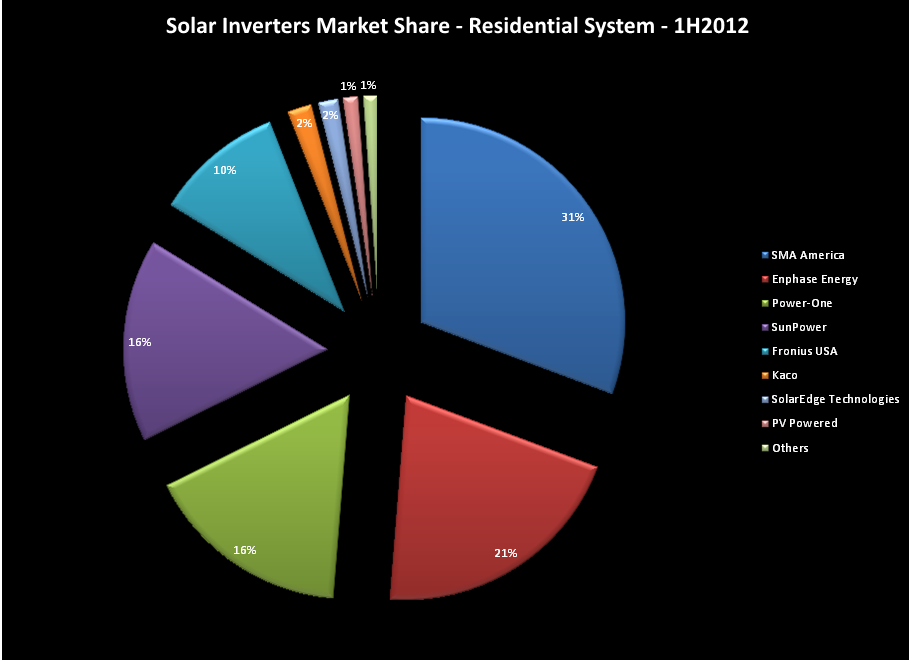 SMA is still the leader, with 31% market share but it is losing ground to our favorite inverter manufacturer, Enphase Energy which now finds itself at 21% of the overall residential market. When just leased systems are considered, Enphase falls to number four with just 12.7%, trailing SMA (32.4%), Power-One (21.7%) and SunPower (16.3%).
Buried amidst the 1% that is “other” are some very well known names that appear to have fallen out of favor, such as: Outback Power Systems and Xantrex, as well as newcomers SolarBridge and Enecsys.
Commercial Trends
When we shift our focus to the commercial segment the number of players drops to just 13, with only 11 cracking the 1% barrier. Here are those results:
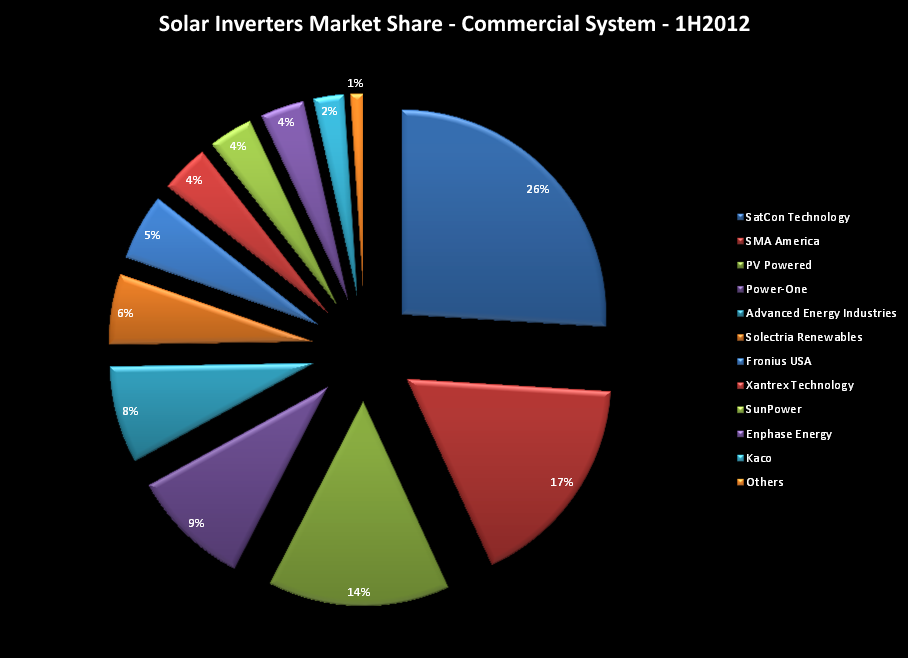 This is a very different graph. SatCon Technology has a clear market lead, despite being dogged by rumors of its imminent demise. SMA is second, but most of that is driven by sales of the same, small-scale string inverters that constitute its products in the residential sector. Enphase weighs in at 3.5%, not a bad number considering that large-scale commercial sales are not its forte (although that may be changing).
Popular Pairings
While our CSI data set potentially allows for more than 2,300 different pairings of inverter and solar panel manufacturers, in reality the number of actual pairings is far smaller, with just five pairings accounting for nearly 48% of all projects. Here are the top five pairs:
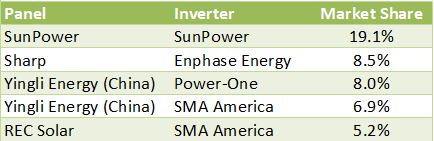
SunPower - with its 19% market share pairings - clearly demonstrates the joy of vertical integration and a strong improvement over last year when that combination accounted for just 12.4%. The Enphase-Sharp combination comes in at number 2, but at 8.5% the combination has fallen from 10.3% last year. (Given that the overall market share for Enphase improved from last year, this “decline” really reflects a broader base of installation combinations.) Yingli is well represented as is SMA (which, of course, is the dominant driver behind “SunPower” inverters which are mostly SMA inverters re-branded). Nowhere to be seen in the top five is inverter manufacturer Fronius which last year accounted for two of the top five entries but this year did not exceed 4% in any pairing. Likewise, last year’s panel leader, Suntech, failed to reach the top five this year and Kyocera was also pushed off stage with no pairing exceeding 2%.
Who’s Hot and Who’s Not?
Next, as we did last year, we decided to take a look at what pairings are the most, and least, costly, efficient, and ultimately, cost effective. As we noted last year, choosing a second-tier (or third-tier for that matter) solar panel by no means assures you of getting the lowest system cost. In fact, when we looked at the top ten solar panel manufacturers by average cost per CSI AC watt, the results are a bit startling:

None of these are top-tier panels, but they surely are commanding top prices! Keep in mind that our overall average price across all systems (excluding delisted) is just $6.23/Watt and you can see that some seriously overpriced systems were built using these panels.
One measure of panel performance (and the only one that can be teased out of the CSI data) is the ratio of PTC panel rating (meant to more closely reflect real-world conditions) divided by the nameplate panel rating (in STC watts), the higher the ratio the better.
The Sun Energy Engineering panels have a dismal 79.25% rating and the average across all of the panels listed here is under 85%. By contrast, Sanyo panels have an average ratio greater than 89%, ten percent higher than third-tier panels from Sun Energy, yet the systems installed with Sanyo panels averaged $6.84/Watt! (We note with dismay that the entry for Sun Energy panels represents only one system, installed in Malibu - perhaps this was an example of zip-code pricing?)
How do our top pairings rank in terms of dollar per watt? Their numbers are all lower than what we see here, ranging from a high of $8.79/Watt for the average of combinations using REC panels to a low of $6.84/Watt for systems using Yingli panels.
What about efficiency? Which equipment pairings produced the highest and lowest efficiency ratings (as measured by the ratio of CSI Rating divided by Nameplate)? This is a more involved number, since it is not simply a function of efficient equipment (although panel PTC/STC rating and inverter conversion efficiency are both included) but also the specifics of the site - azimuth, tilt, shading and geographic location. Nevertheless, good equipment certainly helps so let’s see where the numbers fall. One additional restriction is required - we will limit this to the residential sector. Why? Because larger commercial projects often using tracking mounts that can have efficiencies greater than 100% and would skew our results away from the panel-inverter pairing.
So with that limitation in mind,the highest combination of panels and inverters in terms of efficiency is First Solar panels (thin film) combined with a Fronius inverter for a 90.51% efficiency score (thanks in part to the thin film panels great PTC to STC rating) while the lowest end is a depressingly low of 68.45% derived from MAGE Solar panels and inverters from SolarEdge. (Not clear if even “power optimizers” can rescue a site with such dismal design characteristics.)
What about our most popular panel-inverter combinations - how did they fare on the efficiency scale? Not surprisingly, the SunPower-SunPower combination is the winner at 84.38%, but four of our five favorite pairs are closely bunched: Yingli-SMA (83.28%), Sharp-Enphase (82.43%), and Yingli-Power-One (82.35%). The lone outlier was REC-SMA which came in at a relatively low 80.11%.
Who Uses What?
Finally, as we pivot from a pure equipment analysis to one more focused on the practices of the solar installation companies, we wanted to see what the biggest players are using and how does that affect their pricing? Last year we looked at the top five players, but to give us a broader picture this time around we are looking at everyone with 100 or more projects (excluding projects that are delisted). Here are our results:
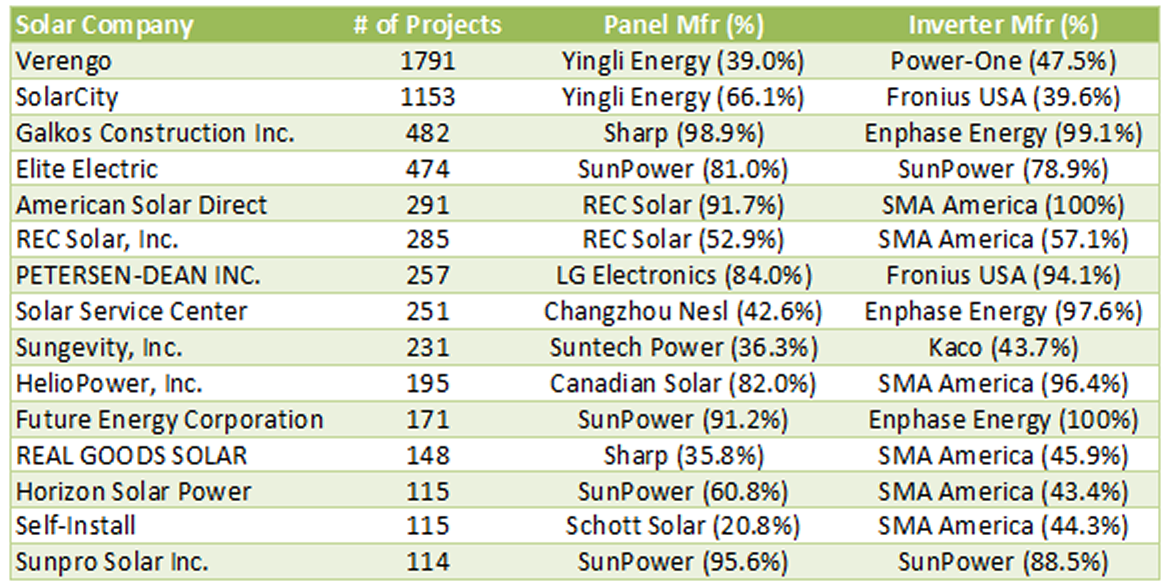
First a comment or two on who made the top five in this list - SolarCity and Verengo have swapped places, Galkos remains at number three (despite our observations about them last year) but REC Solar and Real Goods have been driven down the chart (to numbers six and twelve respectively) to be replaced by previously uncharted Elite Electric and American Solar Direct. (We will have more to say about all of these folks in Part 3.)
Last year Kyocera was the panel of choice for two of the top five; this year Kyocera did not crack the top fifteen, although it was the second choice for SolarCity. LG Electronics found a niche with Petersen-Dean (and was the second choice for Verengo), while Chinese panel manufacturers dominated the list, capturing five of the fifteen slots. Indeed, the big winner on this list would have to be Yingli, increasing its share of SolarCity’s business from 48% last year to 66% now and pushing aside its countrymate, Suntech, to become the number one choice at Verengo. It will be interesting to see how the ongoing trade dispute and imposed tariffs change these rankings next year.
Power-One gets the big boost this year in terms of inverter choices - elbowing past SMA for the top spot with overall leader, Verengo. But if you want to talk brand loyalty, Enphase is the clear winner - when it cracks the list it is used more than 97% of the time!
Collectively, these fifteen installation companies accounted for two thirds of all the solar projects in our CSI data set - but did that translate into lower prices for their customers? To answer that question - and a whole bunch more - in Part 3 we will turn our attention to Outliers and Oddities to discover the good, the bad and the ugly amongst solar companies. You won’t want to miss it!