| « Westridge Chooses Run on Sun for 54kW Solar Project | The State of Solar California - Part 2: Who's Hot and Who's Not? » |
The State of Solar California - Outliers and Oddities - Galkos Construction and SolarCity
09/06/11
Categories: Solar Economics, Solar Tax Incentives, SEIA, SCE, Residential Solar, 2011
The State of Solar California - Outliers and Oddities - UPDATED x2!
UPDATE x2 11/8 - Solar City’s Jonathan Bass adds his perspective on our reporting about Solar City - see his response in the comments.
UPDATE 9/30 - We just heard from Jonathan Bass at SolarCity. Details at the end.
(Still no word from Galkos!)
Editor’s Note: We have now done an updated analysis showing the same data from 2012. You can read our 2012 Outliers & Oddities here.
In the first two installments in this series (Part 1 and Part 2) we looked at the most recent data from the California Solar Initiative (CSI) covering the first half of 2011 in SCE’s service area. Using that data we identified trends in cost, equipment and system efficiency. Along the way, we stumbled upon some Outliers and Oddities in the data that left us puzzled and disturbed. In this post we name names, specifically Galkos Construction (aka GCI Energy) and SolarCity.
Before we explain to you why they are featured in this post, we would remind our readers of the Solar Bill of Rights created by the Solar Energy Industry Association (SEIA) in the Fall of 2009. We wrote at some length about the Bill of Rights when it was introduced, but we want to highlight now what then we termed to be, “the most important right of all:”
8. Americans have the right, and should expect, the highest ethical treatment from the solar industry.
Beyond a shadow of a doubt, this is the most important Solar Right of all if we are to build an industry that is respected and trusted by consumers throughout this country. This should almost go without saying - and yet, saying it, and living it, is extremely important.
In our view, if we become aware of situations that don’t live up to that Right, we have an obligation to point them out so that our potential clients can make the most informed decisions possible.
In honor of that principle we present today’s post.
Outliers: Galkos Construction
In looking at the data, from time-to-time a data point would jump right off the screen. For example, examining all of the residential projects in our data - both “completed” and “pending” but excluding “delisted” - we find that the average installation cost in CSI Rating AC Watts is $8.43/Watt (in DC or nameplate Watts that average becomes $6.99). As we noted in Part 1, that number has decreased over time and also decreases as system size increases. Still, given that the residential sector (as designated in the CSI data) only consists of systems between 1 and 10 kW, you wouldn’t really expect significant price variation between installers over a six month period.
But you would be wrong.
Who Charges What?
Here is a chart of the Cost per Watt for the largest installation companies in the SCE service area (you can click on the chart to see it full size):
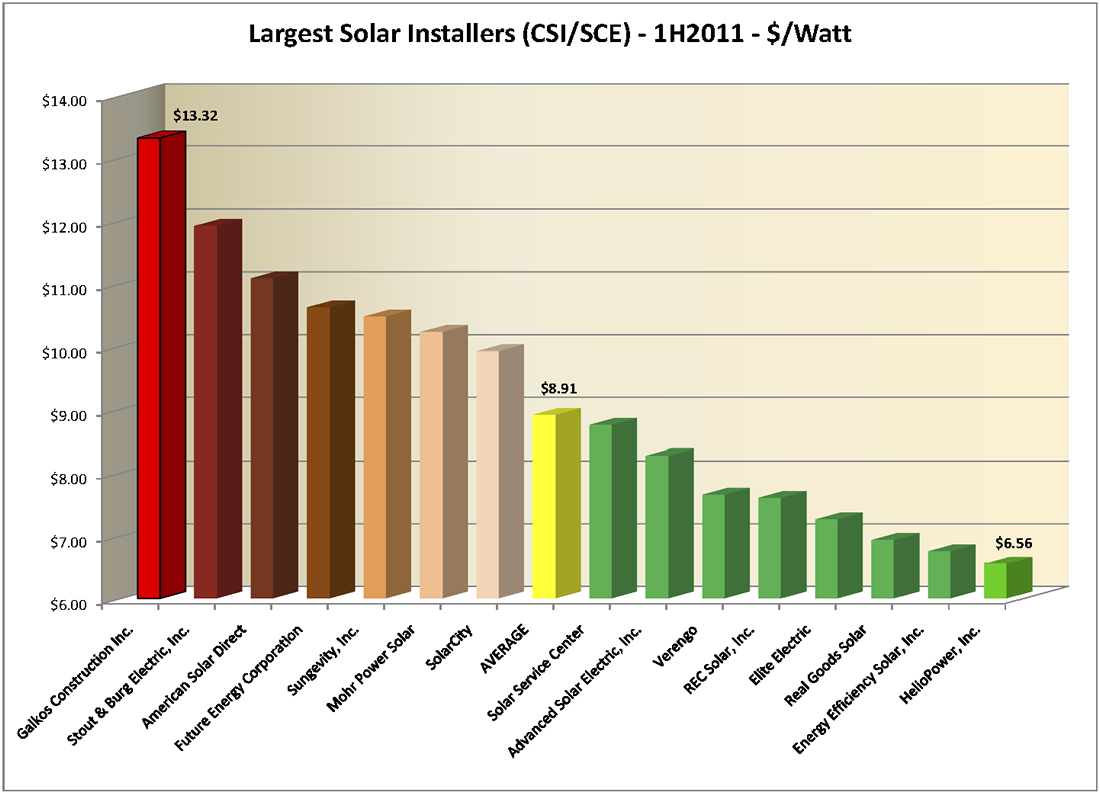
First, let us give credit where it is due. The low end outlier is HelioPower, Inc., at $6.56/Watt, and they did it with an efficiency factor of 87% - second best of anyone on that chart. Nice.
But who is that way off in left field? Coming in at a staggering $13.32/Watt - a full $1.40 higher than their nearest competitor and more than twice what HelioPower is charging - is Galkos Construction, Inc., also known as GCI Energy, out of Huntington Beach. For that money, they must surely be offering only the most efficient and sophisticated technology, right? Not so much. To the contrary, the average installation efficiency for Galkos is only 84.9% - the second worst on the chart and well below the average of 86.11%. In fact, 99% of the time Galkos appears to use Sharp panels - not exactly an exotic solar panel brand - and in particular the Sharp ND-224UC1 panel (66.5%). A quick Google search reveals that the Sharp ND-224UC1 can be purchased, at retail, for $2.65/Watt or less. Given that Galkos handled 400 projects in this data set, it is hard to believe that their price for all of their equipment, particularly the Sharp panels, would not be heavily discounted.
Quality Counts
Quality, of course, is important, and the data does not reveal - though the Internet hints at - the quality of installations from Galkos. Here is how the company describes its own product offerings (from the “Services” page of their website):
Solar by GCI [Galkos Construction, Inc.] Energy
GCI Energy is the largest solar company in Southern California with over 30,000 customers. So you get the most knowledgeable professionals, excellent customer service and a better price.GCI Energy solar offers the highest efficiency solar panels on the market - those manufactured by Sharp. With Sharp Solar Panels, GCI Energy can tailor a solar panel installation to your specific needs and lifestyle, so you get maximum performance without a maximum investment.
(Emphasis added.)
Does Galkos actually have 30,000 solar customers? Certainly not (nobody does). Are they providing “a better price"? It is not clear what their standard of comparison might be - but their price is not better than any of their major competitors in that chart. And of course, the statement does not define what they mean by “the highest efficiency solar panels on the market,” but it seems unlikely that Sharp would make that claim. Here’s one chart that concludes that they couldn’t (note the efficiency of the SunPower and Sanyo panels first, then search for Sharp).
All we can say in response is, caveat emptor.
Oddities - SolarCity
Now we turn to the Oddities section of this post. Unlike the outliers, which were always of interest to us, we were not looking for the oddity we report here - it literally just jumped out at us.
Sold versus Leased
Question: What is the difference in reported cost between systems sold directly to the end customer and those that are leased (i.e., have a third-party owner in CSI parlance)?
The initial difference that we stumbled upon was so startling that we knew we needed to narrow our focus and control for as many variables as possible to isolate that one factor. To achieve that end we restricted the data to those residential systems (i.e., between 1 and 10 kW) that were “pending” in the CSI/SCE data (thus, the newest proposed systems in the data which, based on our Part 1 analysis should mean the lowest cost systems). That way our project sample would be as homogenous as possible, eliminating cost variations based on system size and timing.
Given those restrictions, the top 5 installation companies in which the system is owned by a third party are: Verengo (482 systems), SolarCity (468), American Solar Direct (124), Sungevity (99), and HelioPower (63). Of those five, only two also have direct sales projects pending: Verengo (7) and SolarCity (9). Let’s see how they compare:
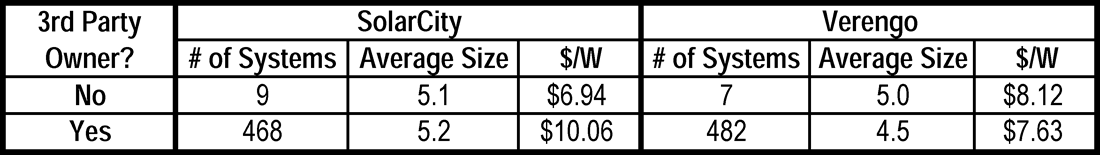
What is going on here? For Verengo, as the number of systems increases - which it does in going from sold systems to leased systems - their cost per Watt decreases - which is what we would expect. But not so for SolarCity - even though they are leasing 50 times as many systems as they are selling, their cost for the leased systems went up - way up - as in up by $3.12/Watt!
(One possible explanation for this discrepancy would be that SolarCity uses much more expensive equipment in their leased systems than they do in the ones that are sold. But they don’t. On their sold systems, SolarCity always selected a Fronius inverter and their panel choices were split among Yingli (56%), Kyocera (33%) and Sharp (11%). On their leased systems, SolarCity selected Fronius inverters 98% of the time and again split their panel choices among Yingli (68%), Kyocera (28%), and BP (3%) with the remaining 1% scattered among Suntech, Sharp and Sanyo. In other words, there is no significant difference in SolarCity’s equipment choices between sold and leased systems.)
Why Does this Matter?
Why does this significant cost differential matter, you might ask? After all, customers aren’t paying that price - they are paying on a lease so the “cost” of the system doesn’t matter to them, all they care about are their lease payments. True enough - unlike the case with our Outlier above, the end customer is not the victim here.
Recall, however, that for systems that are leased, the third-party owner - presumably SolarCity and its investors in this case - receives both the rebates and the tax benefits associated with the installation. While the rebates are independent of the system cost (they are paid based on CSI Watts), not so for the tax benefits. Commercial operators (even though these are residential installations they are treated as commercial projects for tax purposes) are entitled to both a 30% tax credit as well as accelerated depreciation based on the cost of the system.
For the 468 systems that SolarCity is leasing, their total cost is $24,261,735 to install 2,412 kW. If those installations were billed out at the $6.94/Watt they are charging for their sold systems, the installed cost would be $16,739,280 - a difference of $7,524,037. At 30% for the federal tax credit, taxpayers are giving SolarCity an extra $2,257,211 - just from six months worth of installs in only the SCE service area.
Wow!
In the words of the 70’s pop song, How long has this been going on?
How Long Indeed
We decided to find out.
Although all of our analyses up until now in this series have been restricted to the first half of 2011, the actual data set contains entries from the inception of the CSI program. Thus we can look at all of SolarCity’s installs going back to 2007 and compare them as we did for the 1H2011 pending installs above. We will use the First Completed date to group these by year and analyze only “installed” - and not “pending” applications. Here’s the data:
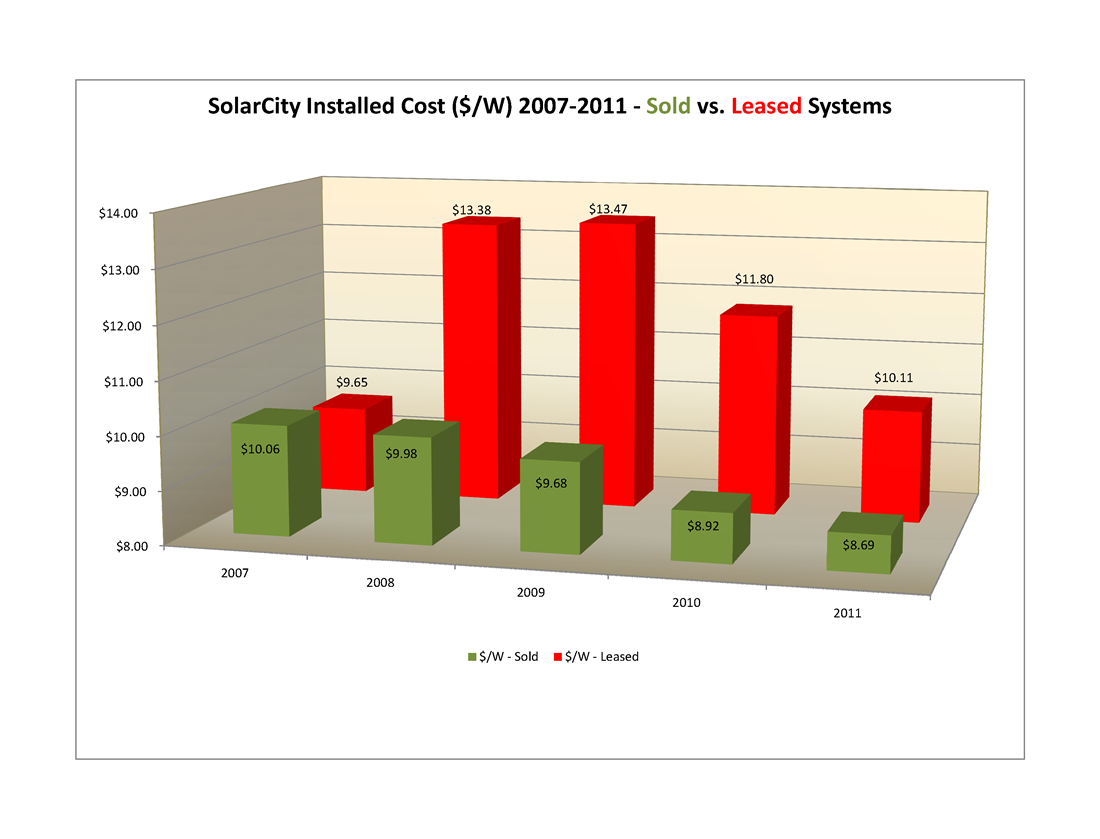
The answer would appear to be, almost from the beginning! Back in 2007, Solar city sold ten times as many systems as it leased. By 2008 the ratio was down to 4-1 and ever since then leasing has been SolarCity’s predominant business strategy with the ratio of leased to sold now standing at nearly 16-1 in 2011.
Bottom Line
What, then, is the cumulative impact to SolarCity’s bottom line from this trend throughout California? We aren’t in a position to calculate the depreciation benefits (since that is a function of the system owner’s tax bracket) but we can readily calculate the added value derived from the 30% federal tax credit due to this increased cost per Watt.
Here is our plot of the cumulative effect of those year-by-year increases:
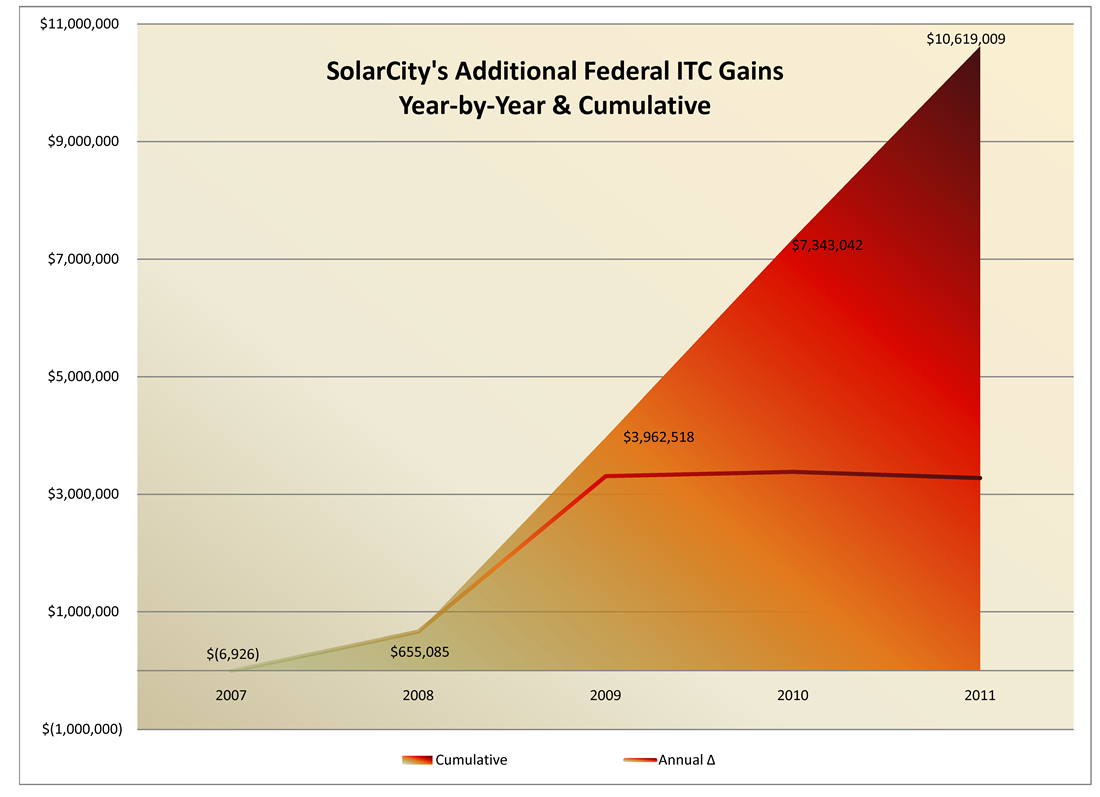
After a slow start in 2007-08, SolarCity’s “model” really took off and has garnered the company an extra $3,000,000+ each year since 2009 (and, of course, 2011 is not yet over) for a total excess accumulation of $10,619,000. Depending on the investors’ tax bracket, the depreciation could be worth nearly as much as the tax credit.
Double Wow!
UPDATE 9/30 - We have now heard from SolarCity
We just heard from Jonathan Bass, Director of Communications at SolarCity who took exception with our report, although he did concede that he could see how we could have reached the conclusions we published in light of the CSI data. We encouraged him to please send us a written response in as much detail as he chose and we would publish it in its entirety. While he agreed that SolarCity would be publishing its response, he did not commit to publishing the information here.
In any event, when we hear more we will update this post again.
What’s Next?
No doubt there is more that we could do with these revelations - but wouldn’t it be better for those with actual oversight obligations to examine this data as closely as we have and to take appropriate action?
As always, we welcome your comments - and if we hear from any of the folks named in this series we will be sure to update the appropriate post.
16 comments


")


Form is loading...