Categories: "Non-profit solar"
07/02/13
Categories: PWP Rebates, Commercial Solar, Non-profit solar, Westridge PAC Project
Westridge Case Study: Part 2 - Run on Sun Gets it Done!
In Part One of this three-part Case Study we learned how Westridge School chose Run on Sun as their solar contractor. Here in Part Two we focus on the actual process of the installation as seen from the client’s perspective.
Run on Sun Gets it Done
With the paperwork filed and the rebate secured, Run on Sun had a very tight window — less than two weeks in April 2012 — in which to install and connect all 209 solar modules and get the monitoring software up and running. The goal was for the project to be completed and operational by the time Westridge students returned from Spring break, so time was of the essence.
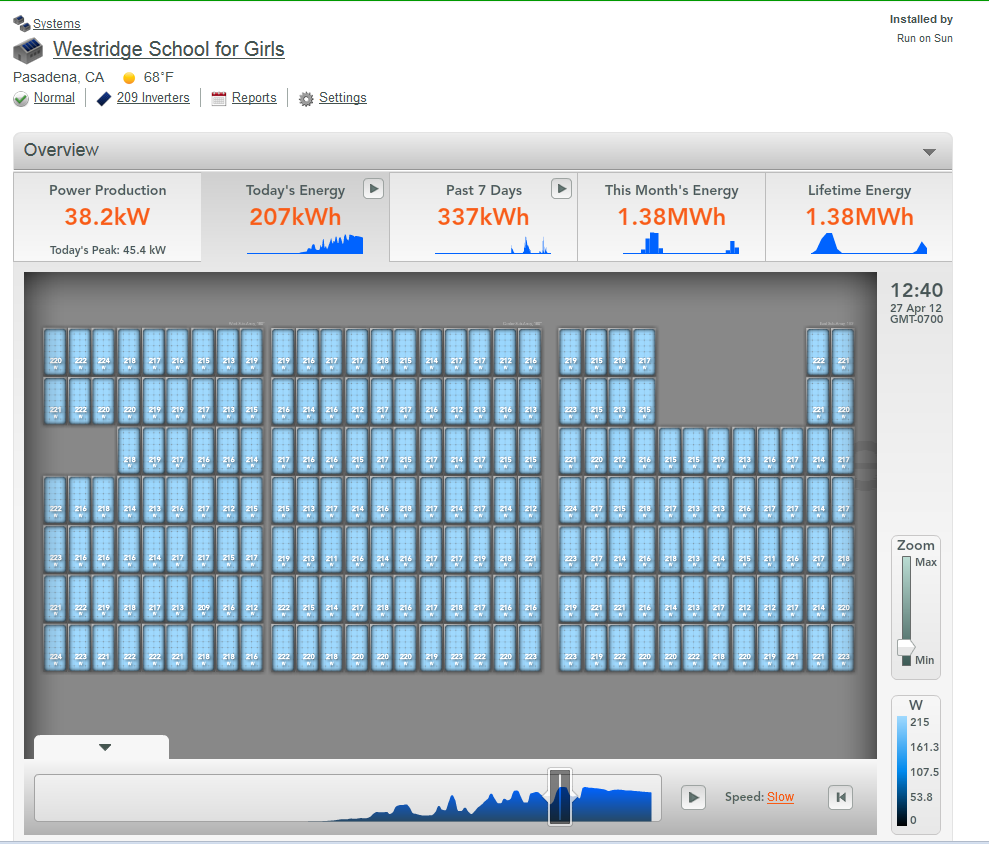 For the rooftop display Run on Sun used a microinverter system supplied by Enphase Energy, which allows customers and solar installers to track the output of the modules, individually or collectively, from the convenience of their computers, iPads or smartphones. This software was a selling point for the school, because it would make the technology accessible to students and allow teachers to creatively incorporate aspects of the solar system’s performance into classroom instruction.
The modules were grouped into three sub-arrays that formed a larger circuit. Under each module, a microinverter was installed to convert DC energy gathered from the module into AC power, which could be combined and fed back into the school’s electrical service. The 1:1 ratio of microinverters to modules allows for a more detailed readout that lets users know the output of each module and gives an easy-to-read display should anything ever go amiss, from a connection issue to dirt on the module’s surface.
Throughout the installation Williams remained on hand to oversee the work, though there were no delays and no change orders requesting funds beyond what had been originally estimated. Within the assigned two-week period, Run on Sun had completed the project on time, and everything was in working order.
A Picture-Perfect Roof, Perfected
“I’ve worked with a lot of contractors, and I can honestly say, in this situation, this was one of the most seamless projects we’ve ever completed,” Williams recalls. “They were here early on the first day and, boom, they got it. It was done on schedule, at the price they said and signed off by the city. I wouldn’t hesitate to do a project like that again.”
A Truly Happy Anniversary
April 2013 marked the one-year anniversary of Westridge School’s solar installation, and Williams reports the system is running smoothly. The Enphase software makes it easy for officials, teachers and students to monitor the activity of all 209 modules, but Run on Sun also keeps a close eye on the operations and reaches out if and when an anomaly is detected. In the event that an outage or a decline in energy production should occur, the company promptly notifies the school.
For example, when one of the modules stopped reporting and apparently needed to be replaced, Run on Sun immediately contacted Williams to schedule a visit. The rest of the modules were still in full working order, and upon close inspection it was revealed that a connection had come loose. Still, to ensure maximum performance, the company replaced the microinverter at no cost to the school.
Another time Williams received a notification email from Run on Sun after the campus Internet connection had been temporarily cut during some service upgrades. And when the energy dipped from its norm of exceeding system predictions to 98 percent of anticipated, a call came in with a recommendation to check the array for accumulated dirt. After a brief spray with a hose, the system was back to producing at maximum capacity.
At the one-year mark, the school became eligible to receive its first annual rebate from Pasadena Water and Power. This is the first of five annual rebates it will receive, the dollar amounts directly correlated to the system’s actual production.
When a technician came from the city to assess the energy output of the system, the school was excited to learn the results. The city’s readings gave some very welcome news, indeed — the energy generated by the installation was above and beyond the original estimate provided to PWP, and it looked like the first rebate would be larger than anticipated.
“He said, ‘You’re over your estimate,’ and that’s all we could ask for,” says a thoroughly pleased Williams. “To date, everything that was promised to us was delivered — plus.”
In terms of the amount of energy generated, the rooftop system has continued to outpace expectations. The school expected to see a return on its investment in seven years, but it’s shaping up to come in as few as six. Because of the installation, Westridge is using 30 percent fewer kilowatt hours and is seeing its bills reduced by thousands of dollars each month, in addition to the rebate. The overall savings is far greater than the cost of running the air-conditioner in the gym, the initial impetus for bringing solar to campus. To Williams, making the decision to go solar was a “no-brainer.”
“The neat thing about this is it runs itself. If somebody walks onto campus, they don’t know we have a 52 kilowatt solar system on campus,” he adds. “They don’t see it. It doesn’t impact anything. All you do is save money.”
We will conclude this three-part Case Study with Part Three - Advice for the Solar Reluctant.
The preceding is an excerpt from Jim Jenal’s upcoming book, Commercial Solar: Step-by-Step, due out this summer.
07/01/13
Categories: PWP Rebates, Non-profit solar, Westridge PAC Project
Case Study: Westridge One Year Later
Today we begin a three-part series offering a Case Study of the Westridge project, one year later. Part One reviews the process that Westridge used to choose the solar contractor to build its solar project. Part Two details the actual construction and the experience of the School in managing the project. Part Three concludes with some advice to the Solar Reluctant on why solar really does make sense.
For the past 100 years, Pasadena’s Westridge School for Girls has prided itself on providing a top-notch education that grooms young women into the leaders of tomorrow.
As part of a legacy of bringing cutting-edge ideas and innovation to campus and making it all come alive in the classrooms, school officials have made it a goal to pursue and complete at least one project related to sustainability on campus each year.
In late 2011, looking forward to the next year, they decided to address a perennial request made by parents and students over the years: that an air-conditioning system be installed in the school gymnasium to keep crowds cool on hot days. While the school could likely raise funds from the parent community to purchase and install a system, the financial and environmental impact of running it and creating a new drain on the power supply were less than sustainable, says Brian Williams, Westridge’s Director of Facilities.
So, to offset the cost and energy consumption of the desired air-conditioning unit, officials decided to fundraise for another project at the same time, one that would mitigate the cost and consumption of the A/C.
They asked parents and students if they’d be willing to raise money to install a solar system on school grounds.
Big Plan on Campus
Solar energy was not exactly new to the school. In 2009, Westridge had installed a small system on its newly built LEED-Certified Platinum science and math building. There some of the panels were placed near the ground, where students could see them up close and interact with the technology.
For the new project, however, school officials were thinking much bigger. They wanted to maximize energy savings by installing a large-scale system that would provide a solid and swift return on their investment and take advantage of a local rebate being offered by Pasadena Water and Power (PWP) that was set to decrease drastically after the end of the year.
Ideally, the new installation would generate enough energy to cover the usage from the A/C in the gym and still supply additional power to other buildings on the campus, saving on the school’s overall monthly electric bill. At the outset, there were no specific parameters for the project, Williams said, just a location.
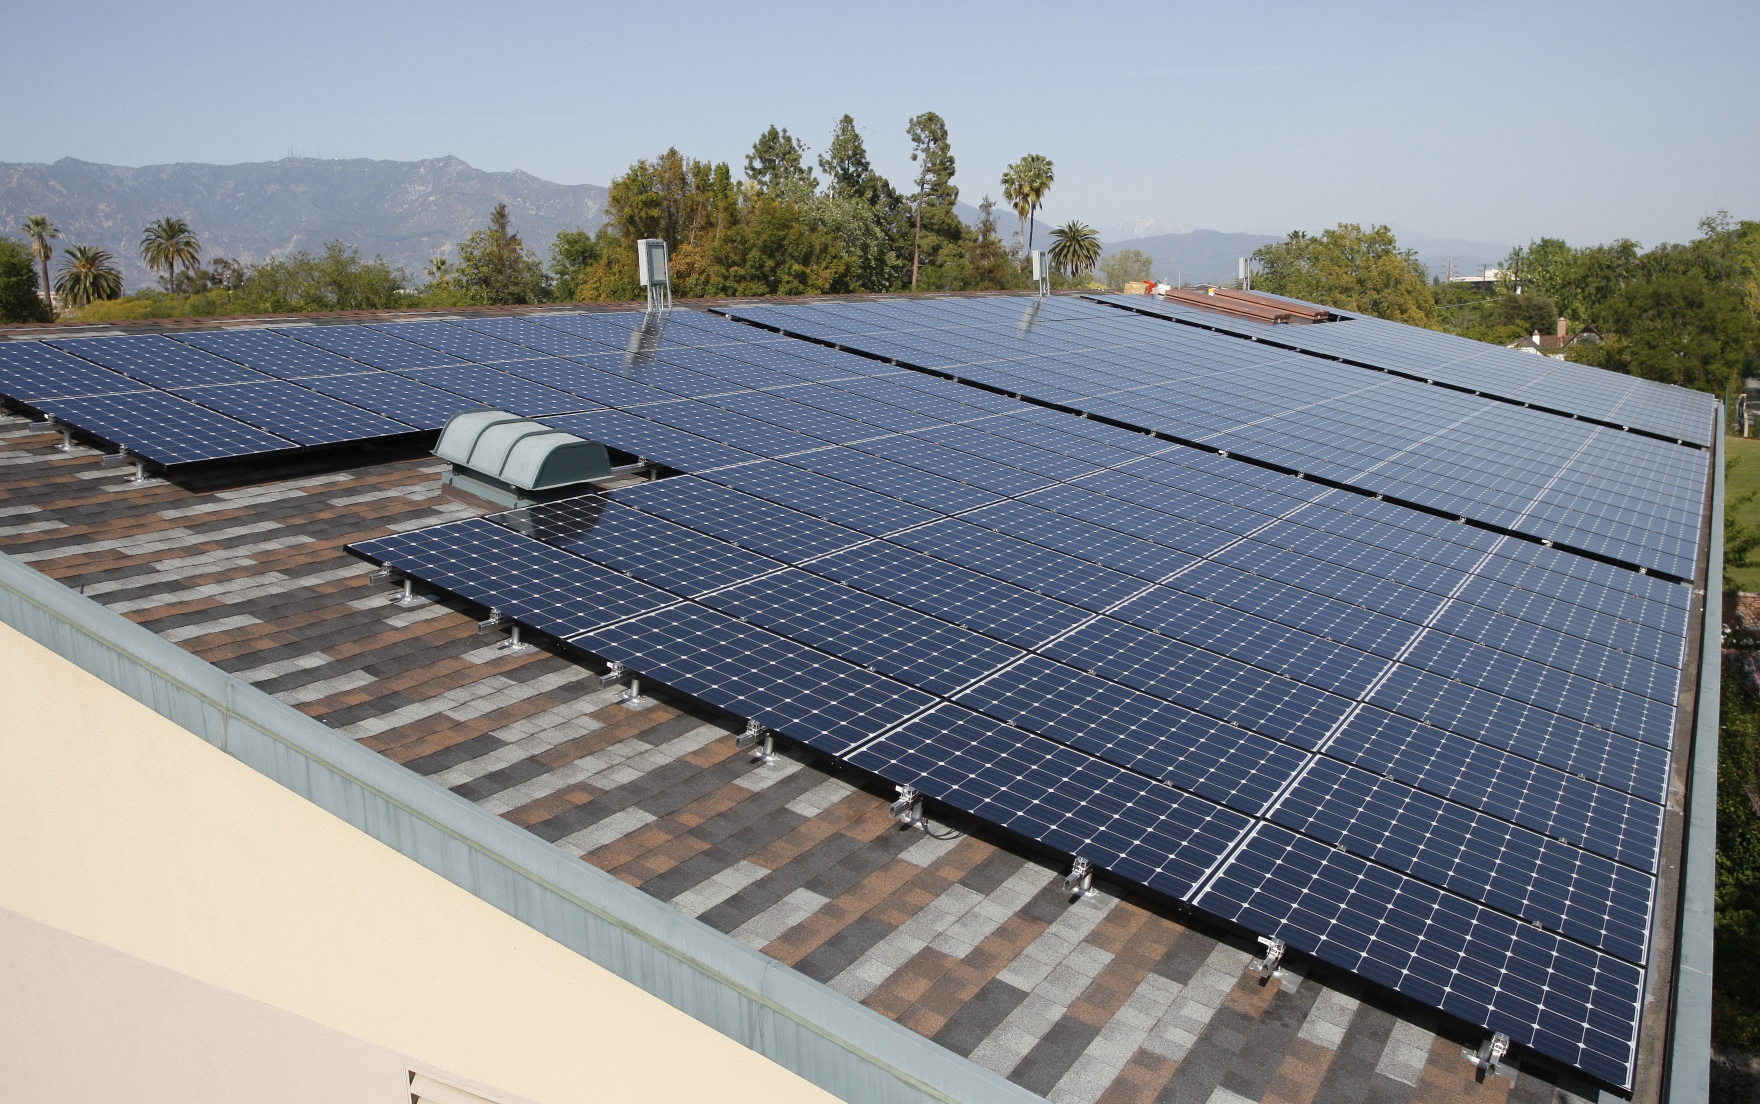
A Picture-Perfect Roof for Solar
“We found our biggest roof and said, ‘Fill it up,’ he says.
The south-facing slope of the roof of the Fran Norris Scoble Performing Arts Center would be the perfect place to set up a large installation. With an area of approximately 4,000 square feet, it received direct sunlight throughout most of the day and was elevated enough to tidily keep the operation out of sight.
Doing their Bidding
Williams turned to three different solar companies, seeking estimates to help define the scope of the project and determine a total cost that would guide the school’s fundraising efforts.
The first two companies Williams considered were those the school had worked with on past projects. One was a large, international solar provider that had worked on the 2009 science building installation. The other had previously worked with Westridge on nearby residential properties.
Run on Sun, the third provider approached regarding the installation, was the only one the school had not personally worked with before. The Pasadena-based company had contacted school officials earlier that year and delivered a presentation on its installation process, qualifications and services provided. That presentation was fairly comprehensive, and made enough of an impact for Westridge to include Run on Sun in the bidding process.
“We didn’t have any actual experience with them, but they had very good references that we checked as we went through the bidding process,” Williams explains.
Finding the right contractor for the job was a thorough search that employed analysis and research. But beyond that, Williams, who’s worked in the facilities department for more than two decades, relied on his own gut instinct and experience to determine which company could best get the project done in a short amount of time and leave no detail unchecked.
Since Westridge is a privately funded nonprofit, it is not under the same obligation as public entities to accept the lowest contractor bid. Cost, however, was still a primary consideration in selecting an installer.
“I have a fiduciary responsibility in my job to make sure the projects we do here are cost-effective and help maintain our campus in a positive way,” Williams says. “I can’t do anything that doesn’t make fiscal sense.”
The cost estimates provided by the three companies for an approximately 50 kW system were not that disparate from one another, coming in at about $4.25 per watt. One thing Westridge did have to be cautious about in its review of the estimates, however, was the possibility of a provider initially underbidding the project with the intention of requesting additional funds through change orders after a contract had been signed. The contractor who was truly right for the job would be one who provided an accurate estimate up front and diligently held true to that figure.
When considering the PWP rebate, Williams knew the school stood to save about half the total cost of the installation over the course of five years. Additionally, all three bidders told Westridge officials they could expect to see a full return on their investment in about seven years. Overall, the project made great financial sense.
Since the cost estimates that came in from the three bidders were relatively similar, Williams also analyzed each company’s references, experience and credentials. For example, he did consider installers certified by the North American Board of Certified Energy Practitioners (NABCEP) to have an advantage over uncertified companies. Another important factor was the presence of a licensed electrician on the staff. “It’s an electrical installation, and I wouldn’t let anybody who wasn’t a licensed electrician be on site,” he says. “I’m guessing the city wouldn’t allow it either.”
Throughout the selection process, Westridge officials knew they were working under a bit of a time crunch. If they missed the window to apply for the PWP rebate, the project would end up costing significantly more than the amount they had raised. Because of this, hiring an installer who could successfully submit all the paperwork before the fast-approaching deadline, and one they could trust to get the application process 100 percent right the first time, was of critical importance.
In this regard, Run on Sun was a standout, Williams says. They promised to take care of all the paperwork, filing within the deadline period and eliminating the extra bureaucratic steps the school would otherwise have had to take.
“They managed the whole process — I basically [just] had to sign the form,” he says.
The fact that Run on Sun had a strong working relationship with the city of Pasadena was another important consideration that worked in its favor, given Westridge’s own solid standing in the community. The attention to detail and professional accountability demonstrated by the company throughout the bidding process brought the local provider to the top of the list, making the ultimate decision to go with Run on Sun an easy one, Williams says.
“It was a combination of the cost, return on investment, their relationship with the city, the impression we had with the provider, how they presented the information and their references. We looked at all of it.”
Next up, Part Two - Run on Sun Gets it Done!
The preceding is an excerpt from Jim Jenal’s upcoming book, Commercial Solar: Step-by-Step, due out this summer.
08/22/12
Categories: Commercial Solar, Westridge PAC Project
Enphase Features Run on Sun and Westridge School for Girls
We have written at some length about Enphase micro-inverters in the past, but today Enphase returned the favor. Here was the lead story in their Summer 2012 Newsletter that just went out this morning:

That is Run on Sun Founder & CEO, Jim Jenal, posing amidst our solar installation at the Westridge School for Girls here in Pasadena. The article quoted Jim and provided a link back to our video highlighting the Westridge installation. Pretty cool.
Even cooler, however, was the meeting that we had this week with Mark Abrams, the Director of Product Management for Enphase. We met with Mark to provide him with feedback about their existing products and to offer our insights about their next generation product that is still in prototype. This was a great exchange - we told Mark what we loved about their products - but also important ways in which the product could be improved, at least in the eyes of an installer! Mark listened intently, took notes, and promised to see what he could do to incorporate our feedback.
It is hard to over estimate the value of such interactions between manufacturers and installers, yet it doesn’t seem to happen as often as it should. So here’s a note to the rest of the manufacturers out there - if you really want to improve your products, start spending (more) time with installers, and I don’t mean your sales people. (Trust me, we already get more than enough contact from your sales reps.) You might not like everything that you hear, but learning first hand what our problems are is the best way to build a long-lasting relationship with the folks who are the most important to your long-term success.
After all, that might be Jim’s face that you see in that photo, but it’s Enphase’s products that made that project a reality.
05/25/12
Categories: All About Solar Power, Westridge PAC Project
Solar Eclipse - A Data Geek's View
On Sunday, May 20, 2012, an annular eclipse was visible in large parts of the United States, including here in Pasadena. To the data geeks here at Run on Sun, that gave us a view to the eclipse that was just a bit different - a Data Geek’s view, if you will.
One of the great things about having a solar power system that is monitored - particularly with a system like Enlighten from Enphase - is that it automatically captures a great deal of data and sometimes that data can be used to look at some surprising things - like a solar eclipse! So this will be a brief tutorial on how to take a raw data set and turn that into a graphical representation of the solar eclipse. (We used Excel 2010 for our analysis, but any tool that allows for the creation of pivot tables should allow you to do the same thing.)
Hypothesis
We started out with a simple hypothesis - since the annular eclipse covered as much as 80% of the sun’s surface (as seen from SoCal), we would anticipate that there would be a significant impact on the output of a solar power system during the eclipse. If we looked at the data from the days prior to the eclipse (excluding any days that were dominated by cloud cover during the relevant time when the eclipse occurred) we should see a noticeable decline in system output relative to the other days. If we graphed those days on the same graph, the eclipse should be an obvious outlier.
But to test our hypothesis, we would need to gather some data!
Data, data, data…
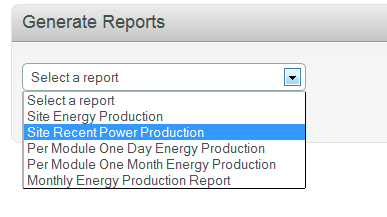 The Enphase Enlighten website allows a system owner to access a variety of reports about how the system has been performing. One of those reports is titled “Site Recent Power Production” and it provides a comma separated values (csv) file that contains the site’s power output over five minute intervals for the preceding seven days.
Excel will open the .csv file and once you have it opened, you can begin the process of massaging the data into the form needed to “see” the eclipse. (If you care to follow along, you can download the dataset that we used by clicking on this link.)
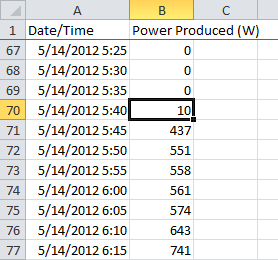
The raw data consists of two columns: a time stamp value and the power produced at that moment in time in Watts. The time stamp combines the full date with the time of day, and as you can see here, the time increases in five minute intervals. Altogether, our week’s worth of data consists of 2,016 data pairs which we will ultimately want to graph.
However, we want to partition the data into seven discrete days (which will then be graphed on top of each other), with hours of the day and five-minute intervals on the X-axis. To achieve that end, we need to add some columns based on the time stamp value. Fortunately, Excel has a number of built-in functions that will let us do exactly what we want to do with a minimum of effort.
By-the-way, it is interesting to note that the system is already generating a significant amount of power by 5:45 in the morning! The system being monitored has 209 solar panels which means that at 5:45 we were receiving, on average, just over 2 Watts per panel.
This ability to produce power at very low levels is another way in which a microinverter system helps to maximize overall system yield.
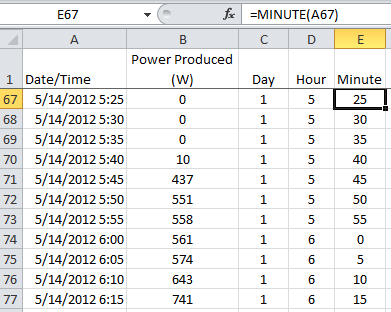
We continue this process by creating columns for the hour and the minute. Fortunately, this is nothing more than using the built-in “hour” and “minute” functions from Excel. By selecting our date/time field with hour and minute, we can establish the remaining data fields that we will need.
However, we now have lots of rows of data to process and making sense of that can be difficult—difficult, that is, unless you use pivot tables.
Pivot Table to the Rescue!
Now we are ready to create our pivot table. For those of you who do not know, pivot tables are a data geek’s best friend, and the means by which massive amounts of data gets distilled into a meaningful table - and ultimately a graph. There are lots of things that you can do with a pivot table but the one we will be using here is very simple.
On the insert tab choose pivot table. For the data source select the power column and the three new columns that we just created. You can embed the table on the current worksheet or in a new one.
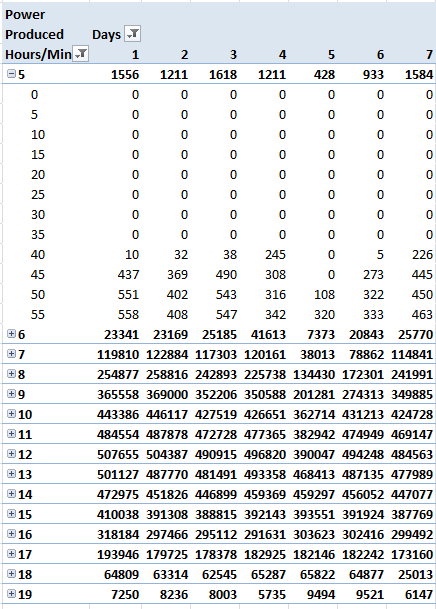
Then do the following:
- Select the “Day” field and drag it to the “Column Labels” box.
- Select the “Hour” field and drag it to the “Row Labels” box.
- Do the same thing with the “Minute” field.
- Now drag the “Power Produced” field to the “Values” box. Note that it gets labeled as “Count of Power Produced (W)” in the box and all of the data values are “1″s. What Excel is doing is counting how many power values there are for each five-minute interval - not what we want.
- To change it, click on the down arrow next to the field and select “Value Field Settings…” Where it says “Summarize value field by” change from Count to Sum and click OK.
- Click on the heading “Column Labels” and type Days.
- Do the same for “Row Labels” and enter Hours/Minutes.
- We don’t need the “Grand Total” so right mouse on that heading and select “PivotTable Options…” Click on the “Totals & Filters” tab and deselect both of the Grand Totals options.
If you’ve followed along correctly, you should have a pivot table that looks like the one on the right.
Click on the drop down filters and deselect the “blank” value for both Days and Hours/Mins. Also, we only want hours where the total power exceeded zero watts, so select Value Filters from the Hours/Minutes drop down. Select Greater Than… and enter 0.
Now we are ready to create our graphs.
A Picture is Still Worth a Thousand Words!
We have distilled our 2,016 rows of raw data into a more manageable form, but it is still hard to “see” our eclipse - time to graph this and let the data speak for itself!
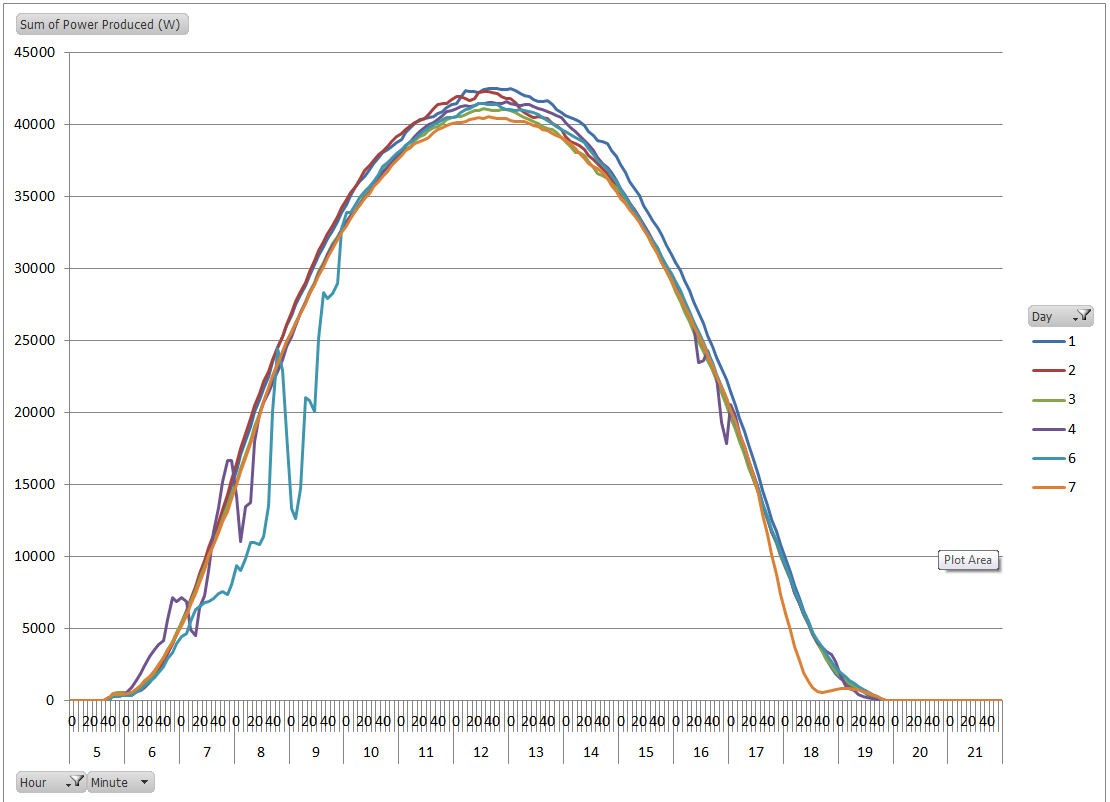
From the PivotTable Tools menu, choose options and then click on PivotChart. Choose a Line chart from the pop-up. Right mouse on the chart and select “Move Chart…” to move it to a new worksheet. This looks pretty good, but Day 5 is very noisy - let’s exclude it. Click on the Day drop down and deselect Day 5. That’s our eclipse graph on the right.
Can you “see” the eclipse now? The chart is still quite busy; let’s exclude some additional days to see if we can make this cleaner.
Return to the Day drop down and exclude every day except days 3 & 7. Now our new graph just tracks two days and we excluded a lot of distractions from what we were seeking.

Here’s our new graph:
The graph clearly illustrates that these two days saw almost identical power production for the vast majority of the day, until late in the afternoon. The timing of that sole difference coincides with our eclipse - can we zoom in for a closer look?
Easily enough we can - all we need to do is limit the time span displayed to the time period associated with the eclipse. The eclipse began around 5:25, reached its maximum roughly an hour later and was over by an hour after that. By selecting the Hour drop down filter we can limit the time period to the four hour window between 5 and 8.
Here is our final “view” of the eclipse:
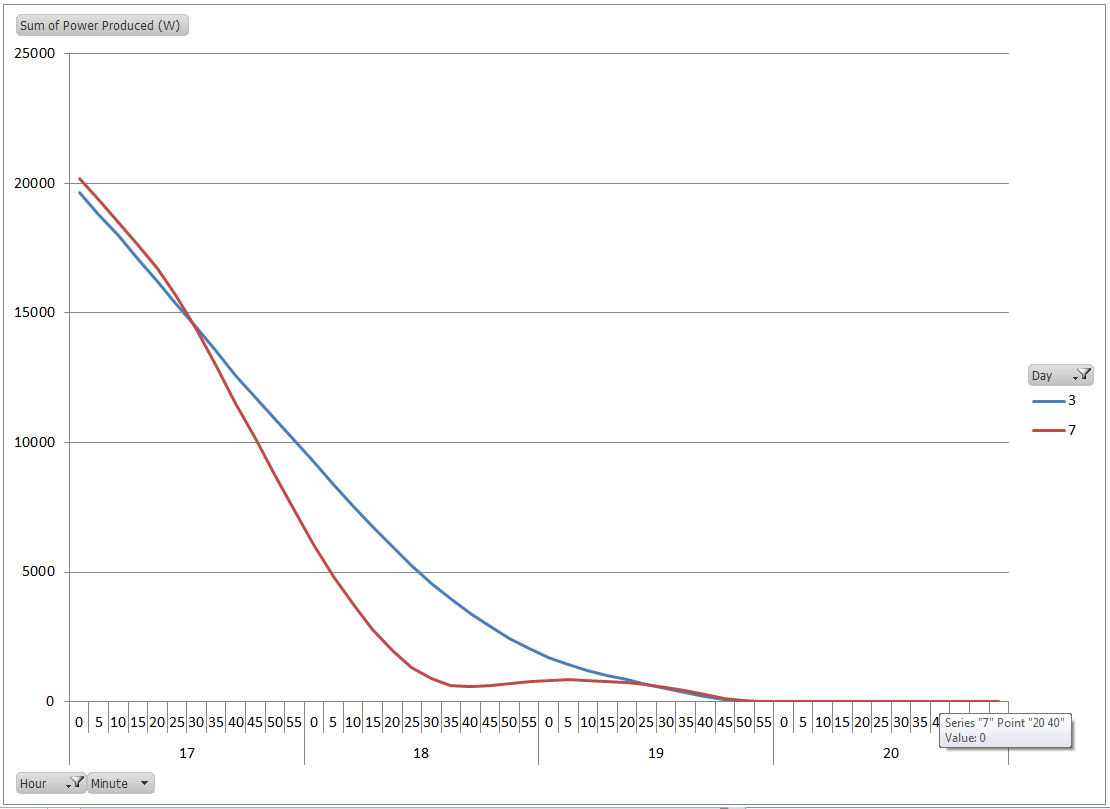
Our final graph clearly depicts the impact of the eclipse on the power output of our solar array.
Monitoring systems are generally considered an important part of commercial solar systems since they help the system owner maximize their investment. However, this is just one example of how a monitoring system can also be used as a tool to observe and quantify other real world phenomenon - making this an important adjunct to a solar power system at a school - like this one at the Westridge School for Girls in Pasadena.
05/04/12
Categories: Commercial Solar, Non-profit solar, Westridge PAC Project
Putting it All Together - Installing Solar at Westridge - Part 5
Here it is - our video from our 52.3kW solar project at the Westridge School for Girls here in Pasadena. Enjoy!
You can follow this link to see the complete series:
Installing Solar at Westridge.