Welcome to the
Run on Sun Monthly Newsletter

In this Issue: |
February, 2017
Volume: 8 Issue: 2
Update: Net Metering 2.0 Coming Soon!We have written at some length about how Net Energy Metering (NEM) works, and about the changes to NEM that are coming, aka Net Energy Metering 2.0. While both PG&E and SDG&E have already switched to the 2.0 version, SCE customers are still able to go solar under the existing, more favorable, rules, but not for long! (NB: PWP & LADWP customers are unaffected by this change, the following is only relevant to SCE customers.) Here is our update as we dive headlong into the brave new world of NEM 2.0. Timing of the changeUnder the rules adopted by the California Public Utilities Commission (CPUC), SCE must continue to allow new customers to operate under the current NEM 1.0 rules, until either of the following events occur:
As of this writing, SCE is still a full percentage point below its cap, with 480 MW worth of solar to install before the cap is reached. Quite simply, that will not happen between now and the end of June, so the deadline to get in on the current rules is 11:59 p.m. on June 30, 2017. But here is the rub—to qualify, not only must the project have been completed, but a final, signed-off inspection card must also be submitted to SCE prior to the deadline. This is going to make June a difficult month as installers struggle to get projects completed and approved in time. Since approvals are at the whim of individual inspectors, many of whom are idiosyncratic (to be kind) in their understanding of what the code requires, it is difficult to guarantee that a project will be approved on first inspection. Key differencesAlthough NEM 2.0 is not the crushing blow to solar that some feared it might become, it still has a number of aspects that make it less appealing to the solar system owner. Here are the major differences:
(Unintended?) Consequences of NEM 2.0The coming of NEM 2.0 has some obvious consequences—there will be a crush this spring to get projects approved before the new rules take effect (so don't wait!), and the overall savings from going solar will be reduced, although not dramatically so.
Another unintended consequence is the significantly increased difficulty in properly modeling the savings to be derived from adding solar. While some installation companies use sophisticated software like EnergyToolbase (as Run on Sun does), or build out sufficiently detailed spreadsheet models (as Run on Sun also does), for many, that level of complexity is simply overwhelming. So what will they do? More than likely, just create a number that is little more than a WAG (and no, not a SWAG). The result is that potential solar clients need to push on companies providing them with solar quotes to justify their savings numbers. If they used something like EnergyToolbase they should be happy to point that out (although there is still the risk that they used it incorrectly...). If they used their own proprietary model, they should be able to explain how it works. But be wary of numbers, especially outliers that claim greater savings without sufficient documentation. |
“To qualify for NEM 1.0 prudent consumers will need to get started by April 15…”

Get your copy of
Commercial Solar:
Step-by-Step
from
Run on Sun
Founder & CEO
Jim Jenal

Now available on Amazon.com
in both
Print & Kindle versions.
Bonus - Buy the Print version…
Get the
Kindle version for Free!
Commercial Solar:
Step-by-Step
from Run on Sun
Founder & CEO
Jim Jenal
Now available on Amazon.com
in both Print & Kindle versions.
Get the Kindle version for Free!
Help Us Spread the News!


We use Angie's List to assess whether we're doing a good job keeping valued clients happy. Please visit AngiesList.com in order to grade our quality of work and client service.
I've got Solar; Why is my Bill so High?Every now and then we get a call from someone who has solar installed at their home but they're not happy.
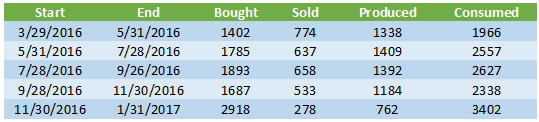
Your system just isn't working!Although this tends to be the number one suspected reason for why the bill is so high, generally it isn't the actual cause. Most systems are installed properly and are in operation. But every now and then we come across a system that simply isn't working at all. That was the case with one man who was convinced that his system had never worked and that the company that installed it was simply out to cheat him. We didn't see signs of that—the system had been installed and the overall workmanship was acceptable on the surface, so it wasn't like someone just slapped the panels on the roof and ran away. But here's the thing—this was an Enphase system so there should have been monitoring in place to answer the question of how well the system was working. Except that the installer had never bothered to complete the setup of the monitoring system! When we came out we were able to access the Envoy directly, and while it could see the microinverters, it was clear that they had never produced any power—in over a year! So how can a solar system owner prevent this? Simple—when your system goes live, make sure that the installer walks you through the operation of the system so that you can see with your own two eyes that the system is actually producing power. (This could be a readout on the inverter/monitoring system, or a spinning performance meter, or an indication that utility meter is going backwards.) Better yet, ask them up-front how will you be able to know that your system is working, and then when it goes live, make them prove it to you! Your system is working, but…This second case is actually far more likely: the system is performing, but it is not meeting your savings expectations. In our experience there are two main reasons for this: hype and over use. Beware the hypeOne reason for this disconnect is that a dishonest sales person over-hyped the savings to be had from the system installed. For example, we have seen "savings" projections based just on the size of the system, without regard for how shaded the system was, or its orientation - to say nothing of the actual rate structure that is being used by the utility. Shaded systems produce less energy. Systems aligned away from South will produce less energy. A utility customer on a time-of-use rate structure may well save less than one on a tiered rate structure (depending on how those rates are designed). The point is to beware of overly simplistic savings projections. A proper analysis will factor in all of these issues to provide the best possible estimate of savings. Solar is not a silver bulletEven the best savings projection is predicated on future energy usage being consistent with the historical data that the solar company was given (unless increases are specifically discussed and included). While many people with solar power systems become vigilant about reducing their overall energy consumption, others go in exactly the opposite direction. Indeed, it is not uncommon to hear people say that part of why they want to "go solar" is so they can afford to run their air conditioning "more" during the summer. Solar power systems are finite resources—they can only produce so much energy consistent with the size of the system, and most utilities limit system size to the historical energy usage average at the site. If you install solar, but then triple how much energy you use during the year, you shouldn't be surprised if you are not saving any money! What we have here is a failure to communicate!Which leads us to the most likely culprit—there has been a failure to communicate between installer and consumer. At the root of this is Net Metering and the complexities of most energy bills. (A big part of the blame here goes to the utilities who seem determined to make their bills as complicated as possible!) Let's provide an overview of this issue and then illustrate with a specific example. How Net Metering WorksSolar system owners - at least here in SoCal - operate under utility rules known as Net Energy Metering, or just Net Metering for short. Here is how this works: on the day when your solar power system is given "Permission to Operate" (or PTO) by the utility, your billing will shift to Net Metering (often the utility will change your meter to allow for that switch). Every day, as your system operates, you will either be exporting (selling) energy back onto the grid, or importing (purchasing) energy from the grid. Think of it this way: you get up at 6 a.m. and it's dark outside. You turn on some lights, the radio, coffee maker, etc. Your solar system isn't producing anything (it's dark outside, remember?) so you are purchasing energy from the grid. You go off to work as the sun comes up, and your system turns on. All day long, your solar system is producing energy, but there is no one there to use it—the A/C is off, the TV is off, the house is dark—so all of that excess energy is sold back to the utility. Your fancy new meter keeps track of all of that energy coming and going. Every billing cycle the utility will look at those readings—how much energy did you sell compared to how much did you purchase—and "net" out the difference. If you were a net seller of energy, you will have a credit. If you were a net purchaser of energy you will have a balance due. But here is where some people get confused—your bill won't ask you to pay for the energy you used that month. Typically you will only be charged for whatever "customer charge" there may be along with taxes and other fees. The bill for your energy usage (or credit, if you are so lucky) is carried forward to the next billing cycle, and the next, and the next, until you get to the anniversary of your PTO date. Now your usage will be "trued up" and you will either get a bill to pay (assuming that for the year you were a net energy purchaser) or a check (assuming you were a net energy seller, but don't get too excited because that payment is really tiny). Here's the thing, depending on how much of a net energy purchaser you were, that bill could be pretty significant, in some cases well over a thousand dollars or more! Of course, you would have been receiving bills every cycle that showed what you were accumulating (either a balance due or a credit) but since there is no related payment required, it is easy for some to overlook those bills, and if this process has never been explained—or even if it was but the consumer simply didn't "get it" at the time—this can lead to a nasty surprise. Bottom line - solar companies need to do a better job here in explaining how this works. (Hence this post!) A real-life exampleConsider a hypothetical solar system owner, let's call him Bob. Now Bob is a smart guy, but this is the first solar power system he has ever owned. His installer explained everything to him when the system went live, but Bob was distracted by the excitement of a potentially zero bill. His system has Enphase microinverters so he has been receiving energy production emails from Enphase every month, and that looked cool, but he never attempted to reconcile his Enphase report with his utility bill (Bob's not so big on balancing his checkbook, either). But to be fair to Bob, the Enphase report that he receives is for each calendar month, but his billing is every two months, and they aren't calendar months; rather, they run from meter read date to meter read date (e.g., 7/28/2016 to 9/26/2016). The good news is that Enphase has a reporting feature that allows you to enter any two dates since the system went live and receive day-by-day energy production, with the total at the end. Let's see what we can learn when we put Bob's billing data next to his production data from the Enphase reporting feature:
The first two columns show the start and end dates for each meter reading/billing cycle. The bought column is the amount of energy that Bob purchased from his utility. (Whoa, what happened during the latest billing cycle???) The sold column is the amount of energy that Bob sold back to his utility during that period, as reported by the utility. The next column is the amount of energy that Bob's system produced during the dates in the billing cycle, according to the Enphase website. But wait, how can this be? In that first period, the utility says that Bob only sold 774 kWh of energy, but Enphase says his system produced nearly twice as much, 1,338 kWh! How do we make sense of this disparity? The answer is simple: local consumption. It is important to remember that the utility has no idea how much energy Bob's system is producing, all they see is how much energy Bob is selling back to them. So both Enphase and the utility are correct, they are just measuring different things. Enphase measures total energy produced. The utility measures energy sold to them—the difference is energy used to power Bob's house that didn't come from the utility; rather, it came from the solar system! In that first billing cycle, Bob's system produced 1,338 kWh and of that, 774 kWh were sold back to the utility, meaning 564 kWh of that production were used to power his house. And that means that Bob's total consumption for the month is the amount that he bought from his utility, 1,402 kWh, plus the solar production that was consumed locally, 564 kWh, for a total consumption of 1,966 kWh. Applying that reasoning to the rest of the data shows that Bob's overall consumption has increased in every billing cycle except one, with a whopper over the holidays! (Maybe too many holiday lights?) The production data shows that Bob's system has been performing appropriately - increasing over the summer months, decreasing over the winter months. Here's a graph that puts that all into perspective:
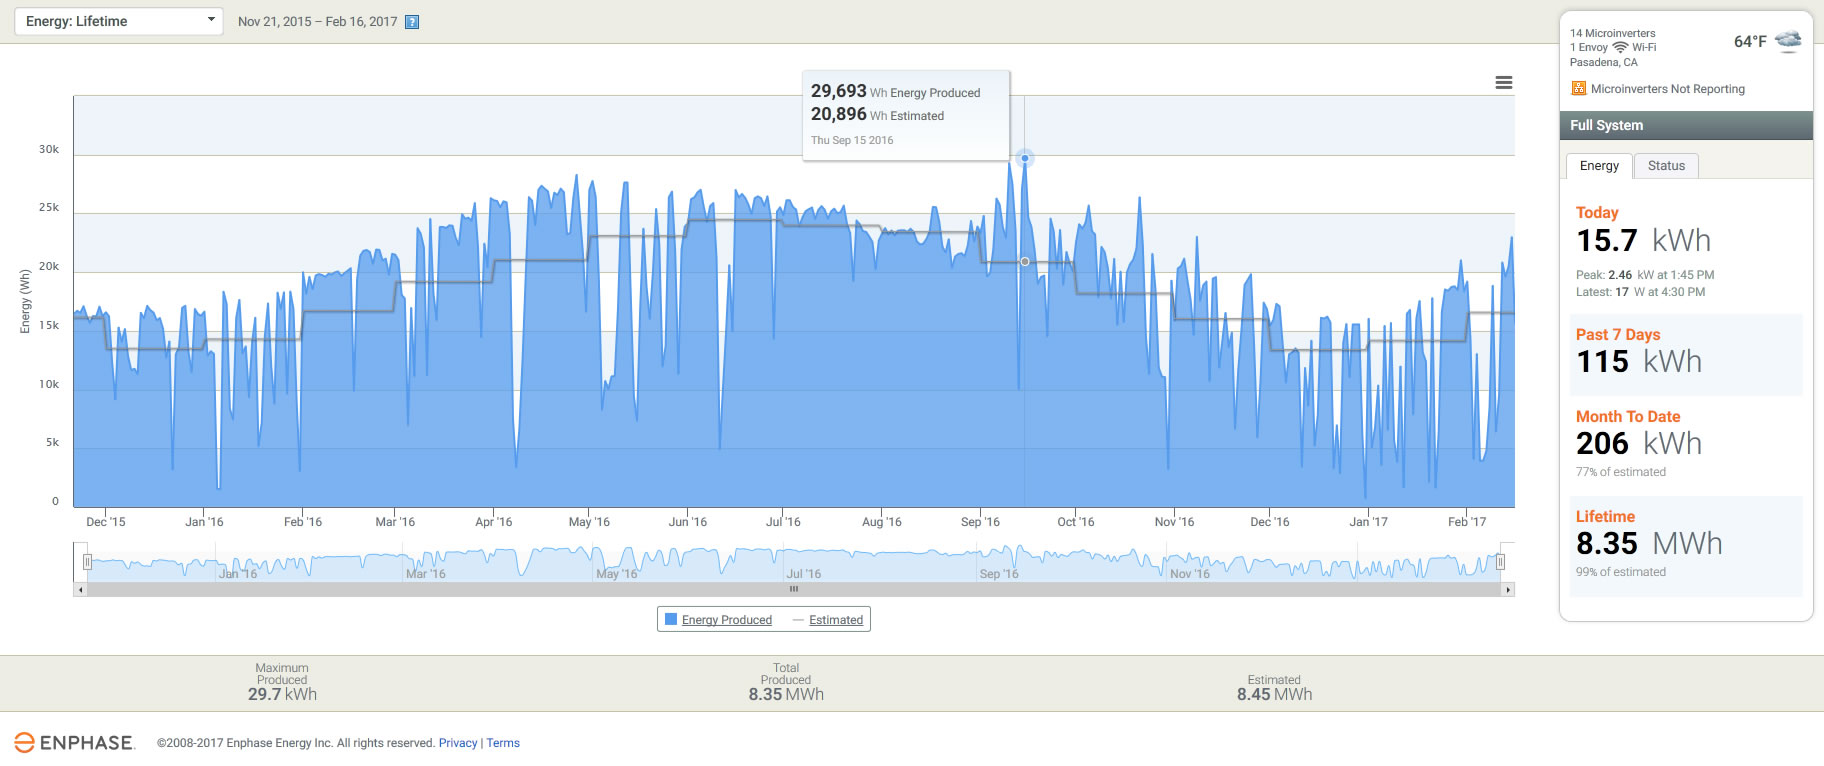
The blue represents the actual energy produced each day. The gray line is the predicted system production (in this case modeled using the CSI calculator). Over the lifetime of the system, the maximum amount of energy produced in a day was 29.7 kWh (42% above what was predicted for that day) and on the day when this graph was created, the system produced 15.7 kWh. Generally, the performance peaks well above what is expected (particularly in the late June through early November period). But once we get into mid-November things deteriorate—not because of a fault in the system, but because of abnormally wet weather here in SoCal (as we head into a 1"/hour rain storm today!). For much of the past two months, actual production has fallen well below what was predicted, with just 77% of predicted being realized so far this month. And yet, despite all of that, overall the system has still produced 99% of its estimated lifetime production. This points out a couple of key things to me: First, you just gotta love the data that is available through the Enphase monitoring system. It allows system owners and installers alike to have near-real time access to system performance, as well as to review long-term data to discern trends and uncover patterns. Priceless! Second, we as solar professionals need to do a much better job of informing our clients so that they know what to expect. (I'm leaving out the hype-sters who couldn't care less what the consumer knows as long as they make a sale.) We live with this stuff every day but for most of our clients, this is all brand new, and confusing. We need to take the time to explain how this works so that they can understand the actual value of their investment. |

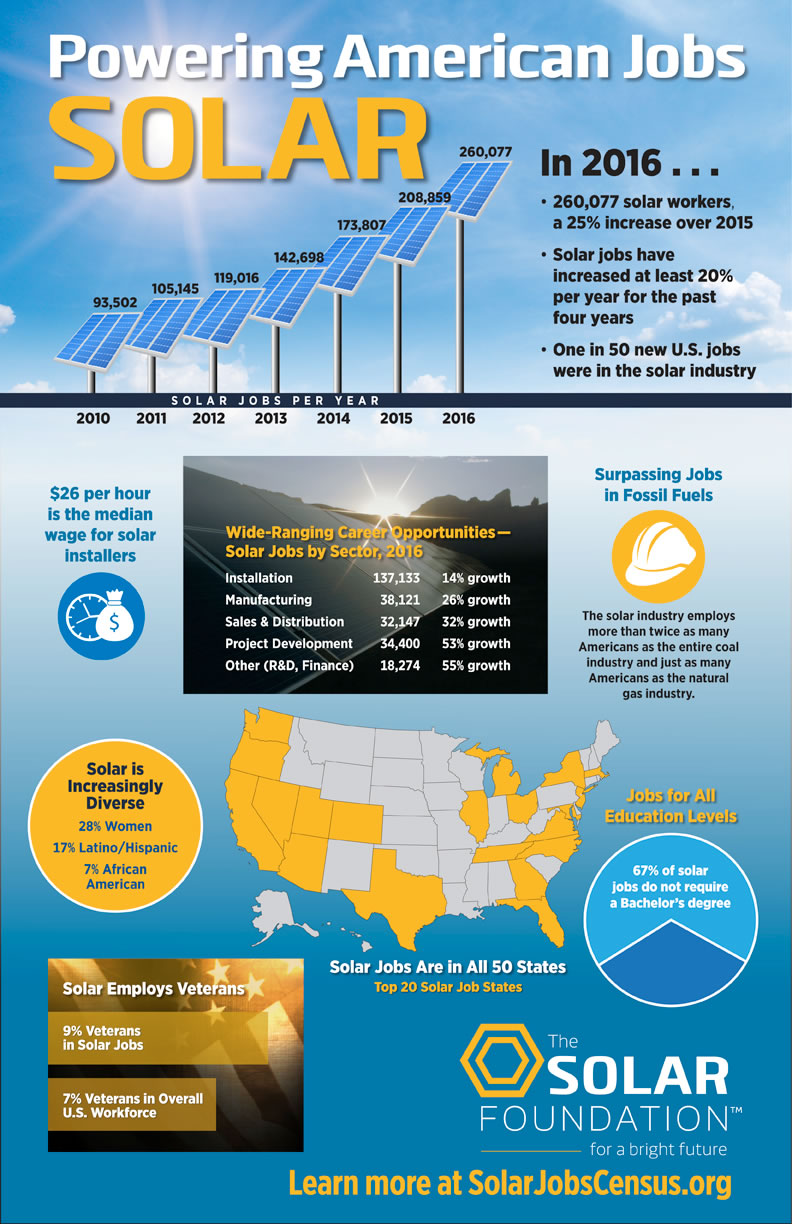
Solar Means Jobs!
Nowhere is that job growth more explosive than right here in California, with solar jobs increasing by a staggering 32% from 75,598 in 2015 to 100,050 in 2016! Moreover, these are good paying jobs, with the median salary for solar installers coming in at $25.96 per hour. The solar industry has reached these levels thanks to the very hard work of many people who strive to make the industry better every day, and thanks to solar-friendly policies at both the state and federal levels. Policy makers, from the President on down, should keep that in mind as they contemplate changes to energy policy. Today, more than ever, Solar Means Jobs!
|