Welcome to the
Run on Sun Monthly Newsletter

In this Issue: |
May, 2018
Volume: 9 Issue: 5
Solar Policy: A Victory and a ChallengeAs a reader of this blog, you care about solar policy making, and are no doubt aware that the utilities are constantly trying to erode the value of solar. Recently we notched a big win, but at the same time the need for vigilance is ever greater. Here's our take... An Historic WinFirst the win - as you have no doubt heard, starting in 2020, California will require that all new single-family homes include a solar power system. (At present, about one in five new homes has solar added when built.) This will help California meet its ambitious goals regarding greenhouse gas emissions, and will continue California's leadership in home energy efficiency. An Ongoing ChallengeAs exciting as that news was, it makes it far to easy to overlook the constant, ongoing efforts of utilities, particularly the Investor-Owned Utilities (IOUs), like SCE, to erode the value of solar. Case in point, SCE has a rate case before the California Public Utilities Commission that attempts to create rate structures that are blatantly hostile to solar power systems. That means that SCE customers who installed solar in good faith, could see the value of their investment diminished thanks to a concerted effort by SCE to do just that!
Fortunately you don't have to take this lying down. The Solar Rights Alliance (formerly known as Solar Citisuns) is working to organize solar system owners into a potent political force to push back against the army of lobbyists employed by the IOUs. There are over 700,000 solar system owners in California - that is an interest group that needs to be heard. By joining the Solar Rights Alliance you will help to make sure that your interests are being heard by legislators and regulators alike. It is easy to join: just follow this link to become an active member of the Solar Rights Alliance. The IOUs have the lobbyists, but we have the people! Be heard - join today! |

“The Solar Rights Alliance is working to organize solar system owners into a potent political force…”

Help Us Spread the News!


LG Expands Warranty to Full 25 Years!
Of course a warranty is only as good as the company behind it—which is yet another reason to go with LG—and it helps confirm our commitment to work with LG to bring our clients the greatest value in the solar industry. We anticipate more exciting announcements from LG in the coming months; watch this space! |

Understanding Tiered vs TOU RatesEDITOR'S NOTE: A couple of years ago we wrote the following piece explaining the differences between a tiered rate structure (like the one that PWP uses) and a time-of-use (TOU) rate structure, which SCE is moving all of its customers to in the coming months. Given that SCE is forcing new solar system owners onto a TOU rate now, we thought it made sense to send this out again. (Note that the specific numbers for these rates have changed, but the underlying logic is the same.) SPOILER ALERT - The following is pretty much down in the weeds. You have been warned! Defining Tiered and Time-of-Use (TOU) RatesLet's start by defining our terms. Most residential electric customers, of both PWP and SCE, are on a tiered rate structure. That means that there are two or more cost steps - called tiers - for the energy that you use. Tiered rates assume that there is some minimally expensive charge for the first allocation of energy per billing cycle, and that as you use more energy your cost for energy increases. For example, SCE's Domestic rate has three tiers and in the first tier the charge is 8.8¢/kWh, in the second tier the charge is 16¢/kWh, but the final tier is 22.4¢/kWh! (There is also a non-tiered component that adds another 6.9¢/kWh to the customer's bill.) PWP, on the other hand, has a somewhat perverse tier structure in that the lowest tier is very cheap, 1.7¢/kWh, the second tier is significantly higher, 13.5¢/kWh, but the final tier actually goes down to just 9.9¢/kWh! Since the whole point of tiered rates is to provide an incentive for heavy users to reduce their usage, PWP is actually rewarding those who consume more than 25 kWh per day with lower rates! Very odd. Time-of-use rates, on the other hand, are generally not tiered. Instead, the day is broken up into segments and the cost of energy varies depending on the segment in which it is consumed. PWP refers to these segments as "On-Peak" (from 3-8 p.m.) and "Off-Peak" (all other hours). But PWP's TOU rate retains the tiered element as well, making it a truly odd hybrid rate structure. SCE's approach is more involved, dividing the day into three, more complicated segments: "On-Peak" (2-8 p.m. weekdays - holidays excluded), "Super Off-Peak" (10 p.m. to 8 a.m. everyday), and "Off-Peak" (all other hours). For both PWP and SCE there is a seasonal overlay on these rates, with energy costs increasing in the summer months (defined as June 1 through September 30). (It is important to note that both PWP's and SCE's TOU rates put the most expensive energy in the late afternoon to evening time period - pricing energy to offset against the "head of the duck." Ultimately, these rates will create the energy storage market in California, but that is a post for another day. Analyzing the Benefits of a Rate Switch - Pre-SolarAssuming that one can create a spreadsheet to model these different rates (not a small task in and of itself!) there is one more hangup - data. Both PWP and SCE report total monthly usage to customers on their tiered rate plans - but in order to analyze your potential bill under a TOU rate, you must have hourly usage data for every day of the year! (Because there are 8,760 hours in a [non-leap] year, such a usage data collection is typically referred to as an 8760 file.) The standard meters that PWP has installed simply do not record that data, so the average PWP customer has no way to know whether they would save money by making the switch. On the other hand, most SCE customers do have access to that data and they can download it from SCE's website.
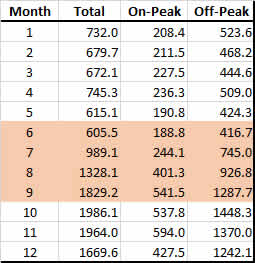
Modeling PWPGiven that PWP doesn't have data available, is there any way to estimate what the results might be? The answer is, sort of. We took an 8760 data set from an SCE customer and used that as our test data for both PWP and SCE. (The data file does not identify the customer.) Since the data file has an entry for every hour of every day, we can segment the usage against the On-Peak and Off-Peak hours, and using a pivot table - probably the most powerful took in Excel - we can summarize those values over the course of the year, as you see in Figure 1.
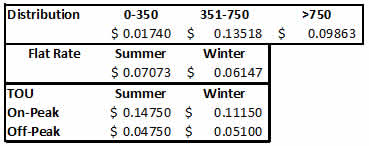
Summer months are highlighted in orange. For this specific energy usage profile, Off-Peak usage is more than twice that of the On-Peak usage (9,806 to 4,009 kWh respectively). So how does that work out when we apply the two different rate structures? The table in Figure 2 shows the details of the two rates:
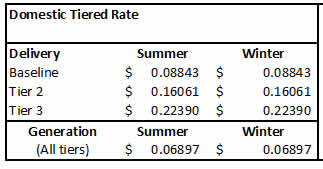
Under both rate plans, the distribution is tiered (with the perverse reverse incentive for usage above 750 kWh). Added to that is either the seasonally adjusted flat rate for energy, or the seasonally adjusted TOU energy charge. Applying those rates to the Usage Profile in Figure 1 allows us to see what the energy and distribution components would be under both approaches. Given the hybrid nature of these rates, you might expect them to be similar and you would be correct. The distribution charge - which applies to both - comes to $1,180 for the year. The flat rate energy charge comes to $893, whereas the TOU charge is $985. Meaning that someone electing to use the TOU rate would have a yearly total of $2,165, whereas the flat rate user would have a total bill of $2,074, making the TOU rate - for this specific energy profile - 4% higher. Beyond that, PWP has a number of other charges - such as a public benefit charge, an underground surtax, and a transmission charge - that are only tied to total usage, so the ultimate difference between these two rates is even smaller. Modeling SCESCE rate structures are significantly more complicated that PWP's. For example, the tier 1 (aka baseline) allocation varies by location. Since SCE covers such a huge and diverse area from cool coastal regions to absolute deserts, customers are allocated more energy per day in their baseline depending upon where they live. In the area around Pasadena that is covered by SCE, a typical daily baseline allowance would be 13.3 kWh in the summer and 10.8 kWh in the non-summer months. The baseline then is that number times the number of days in the billing cycle. Tier 2 applies to every kWh above baseline, but below 200% of baseline. Tier 3 applies to everything beyond that. As with PWP, the tiered rate only applies to "delivery" charges. The energy generation charges are the same all year. Here's what that rate structure looks like:
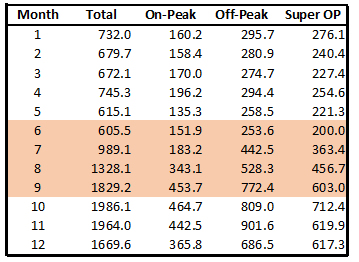
The first thing that you notice when you look at this rate is how much higher it is than the rates from PWP, and the end calculation bears that out - the same usage that resulted in an annual bill of $2,074 in Pasadena becomes $3,227 once you cross the border into Altadena, South Pasadena, San Marino, or Sierra Madre - an increase of 56%! (There's a reason why a growing percentage of our clients are coming from those surrounding, SCE-territory communities!) So what would happen if this beleaguered client were to shift to a TOU rate? First, we need to re-parse the usage data according to SCE's more complicated segmentation scheme, which gives us Figure 4:
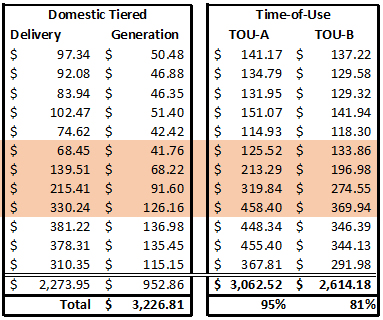
Once again, the On-Peak usage is the smallest category of the three, amounting to just 23% of total usage, compared to 42% in Off-Peak, and 35% in Super Off-Peak. Of course, SCE can't do anything in a simple fashion, so they have not one but two basic approaches to their TOU rates, Option A and Option B. (NOTE: now expanded to 4 options!) Option A rates run from a low of 13¢/kWh (in summer Super Off-Peak), to 29¢/kWh (during summer Off-Peak) to an eye-popping 44¢/kWh (during summer On-Peak). However, Option A includes a credit of 9.9¢/kWh on the first baseline worth of energy which reduces the monthly bill by roughly $30. Option B deletes that baseline credit and replaces it with a "meter charge" (even though it is the same meter!) of 53.8¢/kWh/day, or roughly $17/month. In return, the On-Peak charges are significantly reduced from 44¢/kWh to just 32¢/kWh. So how does this shake out? The results are quite surprising, as shown in Figure 5.
The two left columns show the month-by-month calculations for both delivery (the tiered component) and generation (the flat component). The two right columns show the month-by-month calculations for the two different TOU rates. The bottom line is striking: under TOU-A there is a savings of 5% over the tiered rate, whereas the savings jump to 19% by going to TOU-B! That is a savings of $600/year just by changing rate plans - a switch that any SCE customer can make. MAJOR CAVEAT: YOUR MILEAGE WILL VARY! The results displayed here are entirely dependent on your actual energy usage and no two usage profiles are alike. It is possible, even likely, that some usage profiles will see an increase in bills under either TOU option. The good news is, that for a nominal fee, this is an analysis that we could do for any SCE residential customer - we would just need access to your usage data. |