Welcome to the
Run on Sun Monthly Newsletter

In this Issue: |
August, 2013
Volume: 4 Issue: 8
State of SoCal Solar 2013Every year we pause at mid-year to take a look at the State of Solar in Southern California by examining the data compiled for the California Solar Initiative (CSI). (You can review our analysis for 2012 here and 2011 here.) Our analysis each year consists of three parts: the first (what follows in this newsletter) explains our methodology and highlights some interesting trends in the data. The second part looks at Who is Hot and Who is Not - both manufacturers and installers. Part three is our favorite - Outliers and Oddities - where we name names and expose some curious practices. Please check them all out. MethodologyLet's start with our methodology. The CSI collects a significant amount of data as part of managing its rebate program and most, though not all, of that data is made available to the public. For example, while CSI collects data from installers that identify four components of system cost - solar modules, inverters, permitting and everything else - the data that is made available rolls all of that up into just one number - Total Cost. Nevertheless, the CSI data is the most comprehensive data set available and covers all projects being built in the service areas of California's three investor-owned utilities: PG&E, SCE and SDG&E. For our analysis, we started with the CSI Working Data set from July 31, 2013. (Here's a link to the CSI Working Data download page and here's a link to the data set (11 MB zip file) that we used for this analysis.) This analysis just looks at data from the SCE service area and to limit our time period to just the first half of this year, we added a Status Date field to the data which is the latest of a series of milestone dates recorded in the data (from First Reservation Date to First Completed Date). We then extracted our data for dates from 1/1/2013 to 6/30/2013. After that it is a matter of pivot table magic! One other note - there are multiple ways to identify the size of a project from the data: Nameplate Rating (i.e., DC Watts), CEC PTC Rating (which accounts for the PTC rating of the solar modules used times the efficiency of the inverters chosen) and CSI Rating (which applies the Design Factor to the CEC PTC Rating and which is the basis for rebate payments. For the most part, unless otherwise noted, we will be using CEC PTC Rating for system size since that accounts for some measure of equipment quality but isn't confounded by site complications such as shading or the use of tracking systems. In particular, our $/W figures are computed this way. TrendsOverall, our data set reflects 14,459 projects, up from 9,669 over the same period last year - an increase of 49.5%. There are three program divisions in the data: Residential (projects under 10kW), Commercial (projects greater than or equal to 10 kW) and the Multifamily Affordable Solar Housing (MASH). The overwhelming majority of these projects are in the Residential program: 14,028 (97% of the total) are Residential, followed by 387 (2.7%) Commercial and just 44 MASH projects. However, MASH projects are generally associated with affordable housing developments and so they can be quite large overall. In fact, the average MASH project is 158.7 kW, compared to just 5.6 kW for Residential and 216.3 kW for Commercial. Altogether, Commercial projects account for 83.7 MW, followed by 78.8 MW in the Residential program with just 7.0 MW in the MASH program. Compared to last year, which saw a decline in the amount of solar capacity in the data, capacity this year is up 59% over last year:
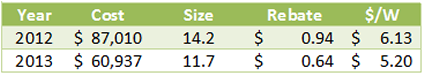
At the same time, the average system size continues to decline from 14.2 kW in 2012 to just 11.7 kW this year. Likewise, rebates are falling (by 32%) but so are overall prices (15.2%), just not as fast.
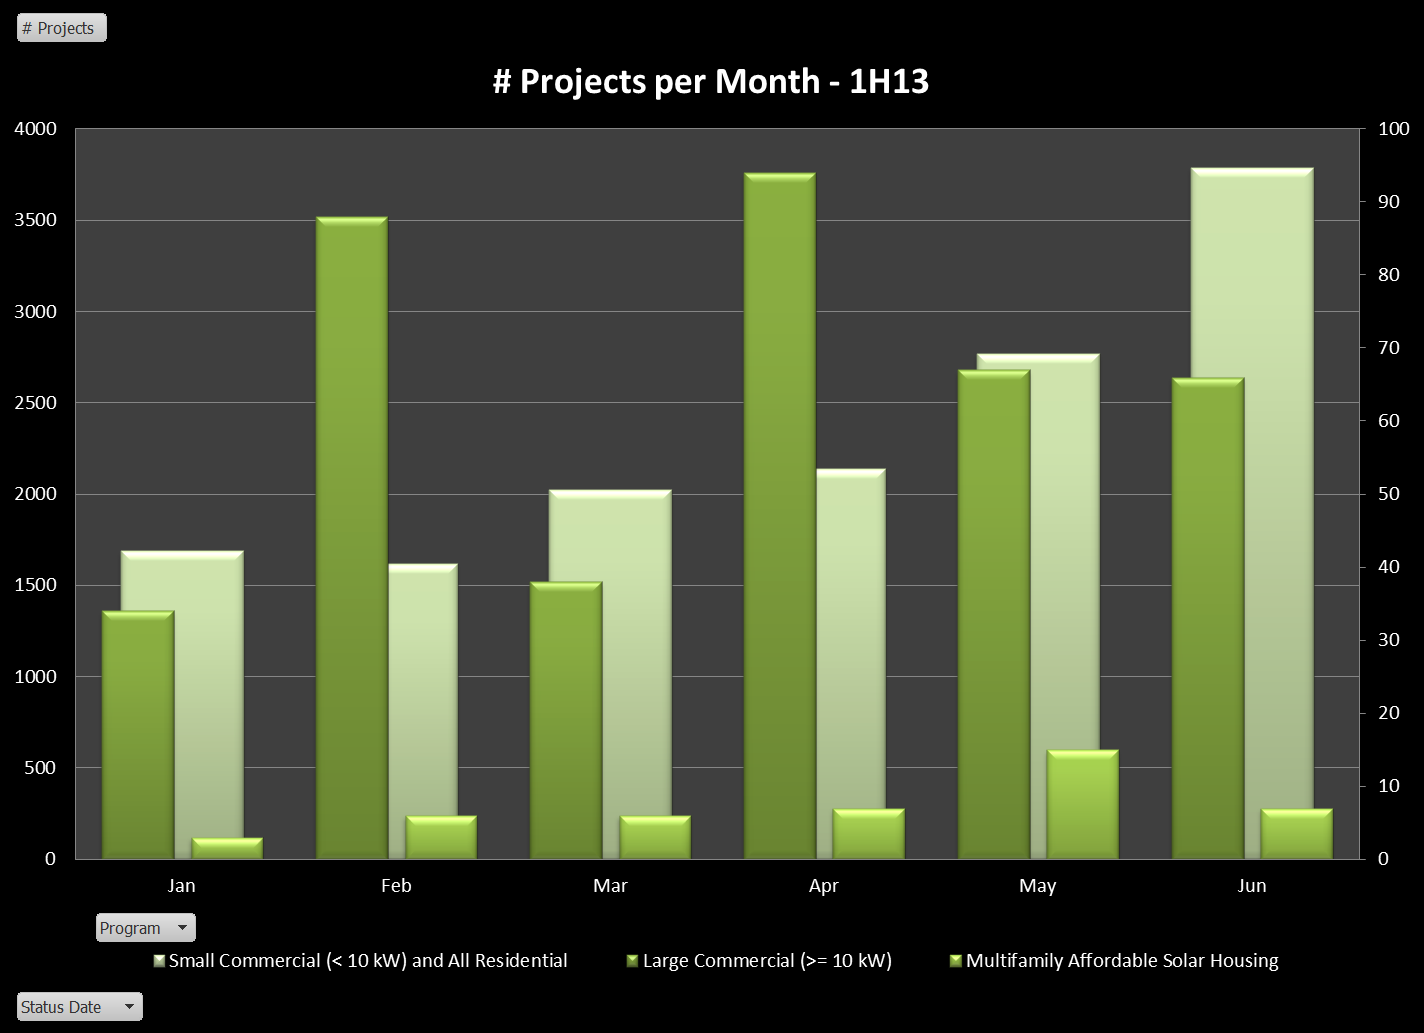
Still, in raw dollars, the reduction in system price of $0.97/W from a year ago, nearly triples the decline in rebate rate. We will have lots more to say about system costs in subsequent posts. The pace of projects is accelerating, driven by dramatic growth in the Residential program (as always, click on the chart to see it full size):
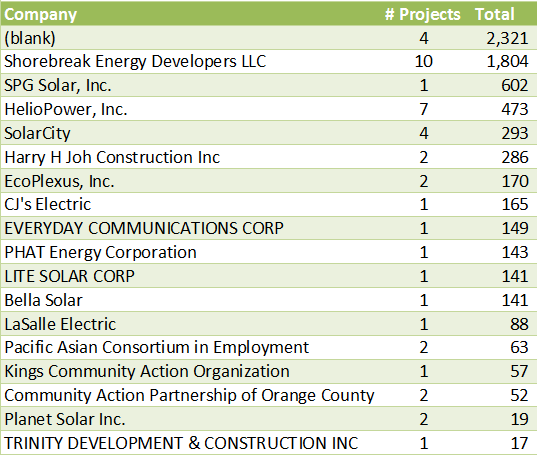
(To make the Commercial and MASH projects visible we have put them on a second axis.) Residential projects have grown from less than 1,700 in January to nearly 3,800 in June! MASH-UpSince it is a relatively small slice of the pie we are going to generally ignore the MASH program but before we leave it aside, we thought we should at least take a peak at who are the players in this program. Here's what we found:
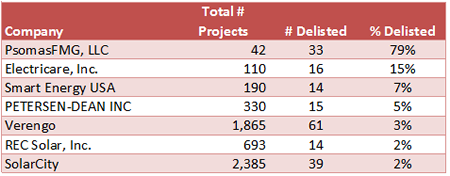
Four projects have no solar contractor associated with them in the data (curious). The big winner, however, is Shorebreak Energy Developers - not a company on our radar, but obviously a major player with nearly 2 MW worth of projects in the program. A few familiar names - HelioPower, SolarCity and even our friends down the road at PHAT Energy (well done, Philippe!). Roughly half of these projects are third-party owned: 24 of the 44 for a total of 3.5 MW out of a total 6.98 MW. The average cost per CEC PTC Watt is also almost identical, $5.52 for third-party owned versus $5.55 for sold systems. Yet within that average was a very significant range from a high of $13.12 for the 141 kW project being built by Lite Solar, all the way down to $4.32 for the 601 kW project being built by SPG Solar. Shorebreak, the leader in the amount being installed and total number of projects is also a leader on price, coming in at $4.90. Making the DelistOne stat we continue to find intriguing is the number of delisted projects - projects that got entered into the data but then cancelled at some point. Altogether, there are 471 projects delisted, or just 3.26% of the total, down from 4.2% last year. Those delisted projects accounted for 16.8 MW of capacity or 9.9%, which is up significantly from last year. In other words, fewer projects were delisted, but they accounted for a bigger piece of the potential installed capacity. The majority of the delisted projects, 324 of them (68.8%) were third-party owned. 149 different companies made their way onto the Delist - not surprising for very large players, but as before we decided to look at these companies as a share of their overall project total. We limited to companies with at least 10 delisted projects and then rank ordered them by the percentage of their projects that are delisted. Here they are:
What is up with this? PsomasFMG has 79% of its total projects delisted? Turns out their 33 delisted projects account for nearly half the the total delisted projects by capacity. Not surprisingly, these are all third-party owned Commercial projects ranging in size from 61 kW to just under 1 MW. The other big winners, Electricare, Smart Energy, and Petersen-Dean had all of their delisted projects in the Residential program with sizes ranging from under 3 kW to just under 10 kW. Interestingly, of the worst actors last year: Remodel USA, Herca Solar and A1 Solar Power, both A1 Solar (4 projects) and Remodel USA (1) still made the delist this go around, but with greatly improved numbers. (Herca Solar has 44 projects overall in the data, none delisted.) While Commercial projects are necessarily more complex, making cancellations more likely, it is hard to understand a 15% delist rate for Residential projects. Caveat emptor. Does Size Matter?Finally, we turn to the question of size, and in particular how well does the size of a project drive down its cost? For this analysis (and most of our analyses going forward) we are excluding delisted and wait list projects from our data. Here's our result for systems at or below 10 kW:
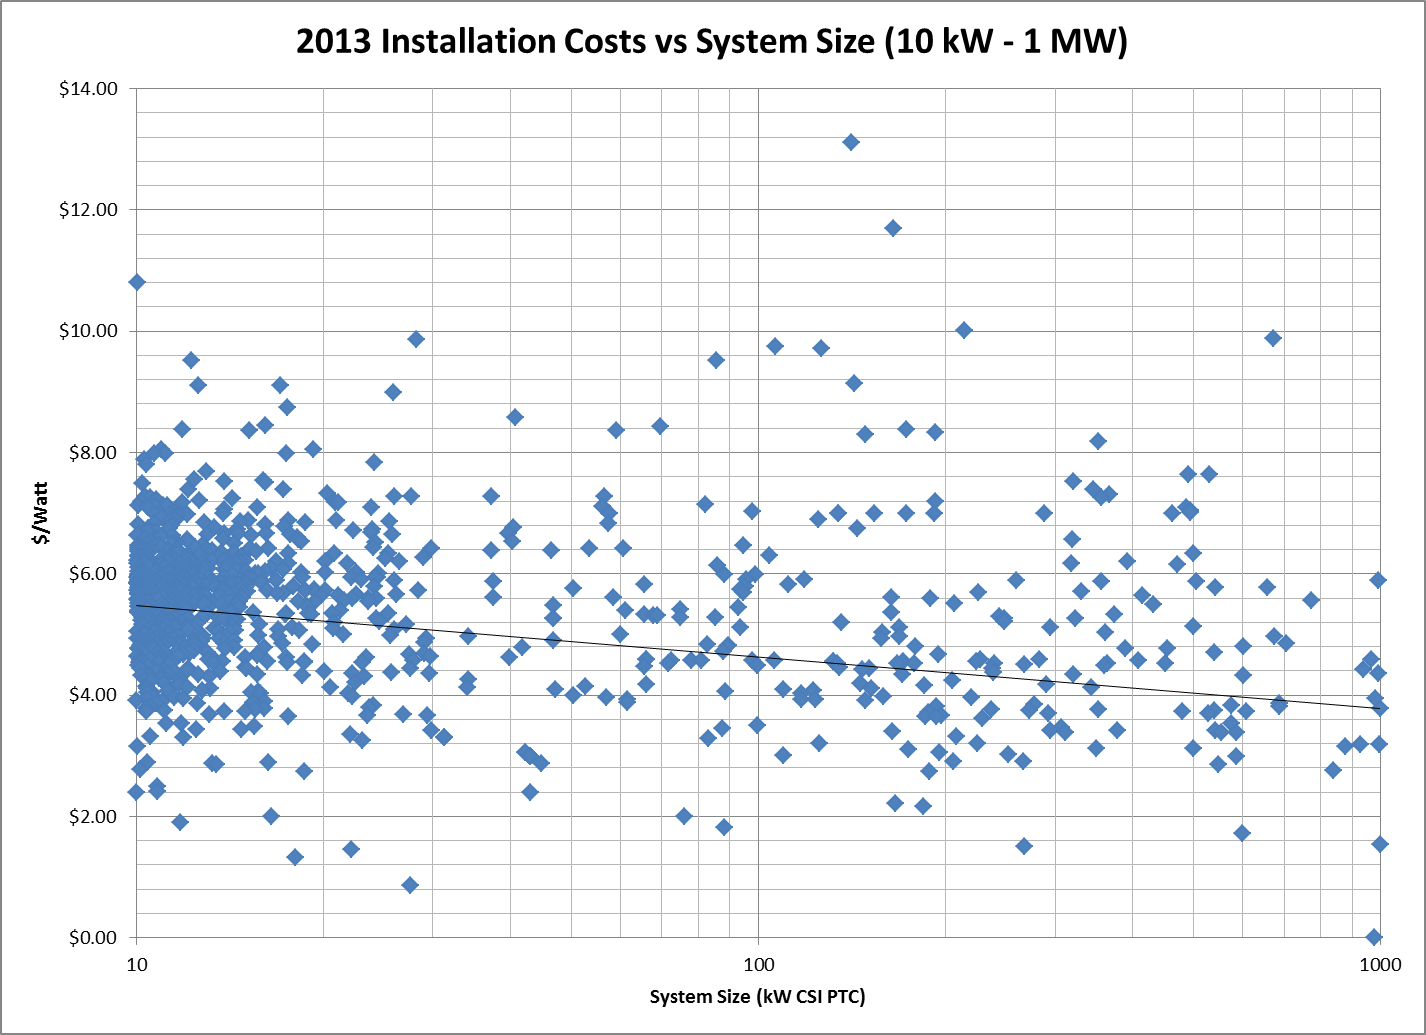
As in the past, we had to exclude a couple of outliers above $15/Watt: the farthest out there was Sun Pacific Solar Electric which charged $21/W for a 1.5 kW system and right behind was California Solar who installed a 7.9 kW project for over $16/W! We will have lots more to say about such Outliers next week. Overall, the trend is clearly moving in the system buyer's direction with the trend line reaching down to $5.40/W for systems sized at 10 kW, while a typical residential project of 5 kW comes in around $5.70/W. Nevertheless, that is a very gradual slope indicating that prices are fairly consistent across system sizes in this program segment. What about larger systems, do we see more of a downward trend there as system sizes increase? Here's the data:
Interestingly, for the smaller projects there is very tight clustering right around the $5.70 mark where the trend line begins. However, as you move up in system size, the clustering breaks down and system costs vary far more widely than they do for smaller systems. Still the trend has 1 MW projects coming in around $3.77/W, compared to nearly $5.20 last year. Ok, that's it for our overview. If you care to check out the rest of this year's series, click here for Who is Hot and Who is Not and here for Outliers and Oddities. |
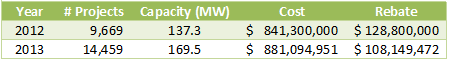

“Overall, our data set reflects 14,459 projects, up from 9,669 over the same period last year - an increase of 49.5%…”
Help Us Spread the News!


SCE Threatens Suit Over Satirical Solar VideoA group of solar advocates have received a cease and desist letter from Southern California Edison over a satirical video that dares to claim that SCE "is committed to rooftop solar - and by committed we mean committed to keeping it off your roof!" Proof that SCE lacks both a sense of humor and common sense. (H/t Chris Clark at the ReWire blog on KCET.org) The three groups threatened - presente.org, the Sierra Club (really!) and The Other 98% - have a website titled Save Rooftop Solar where the video was originally displayed. On their website they make the case that rooftop solar is good for the Latino community. That seems like a fair message to be communicating, but it is the group's attack on SCE's lobbying efforts that drew the IOU's ire. Here's the video that SCE doesn't want anyone to see:
Now this is clearly satire, and no reasonable person viewing this would believe that SCE produced this video. Moreover, in highlighting an issue of public interest - namely SCE's lobbying campaign directed at Latino politicians (no doubt part of their faux "equity" argument) - the use of otherwise protected symbols and logos is certainly "fair use" and thus protected. But that didn't prevent SCE's thin-skinned legal department, in this case Ms. Janet Combs, from sending a short-sighted nastygram:
Here's the thing - first of all, the assertion that SCE has legal claims against the producers of this video is laughable. But beyond that, when a video that practically no one has ever seen goes up on YouTube accusing you of being an evil corporation that is trying to (literally) squash your opponents, you do not counter that argument by sending C&D letters that threaten to squash your opponents. (See also, the Streisand Effect.) Let's hope that these groups get lots of press over this and SCE is sufficiently humiliated over their strong-arm tactics. Well, a guy can dream, can't he? |

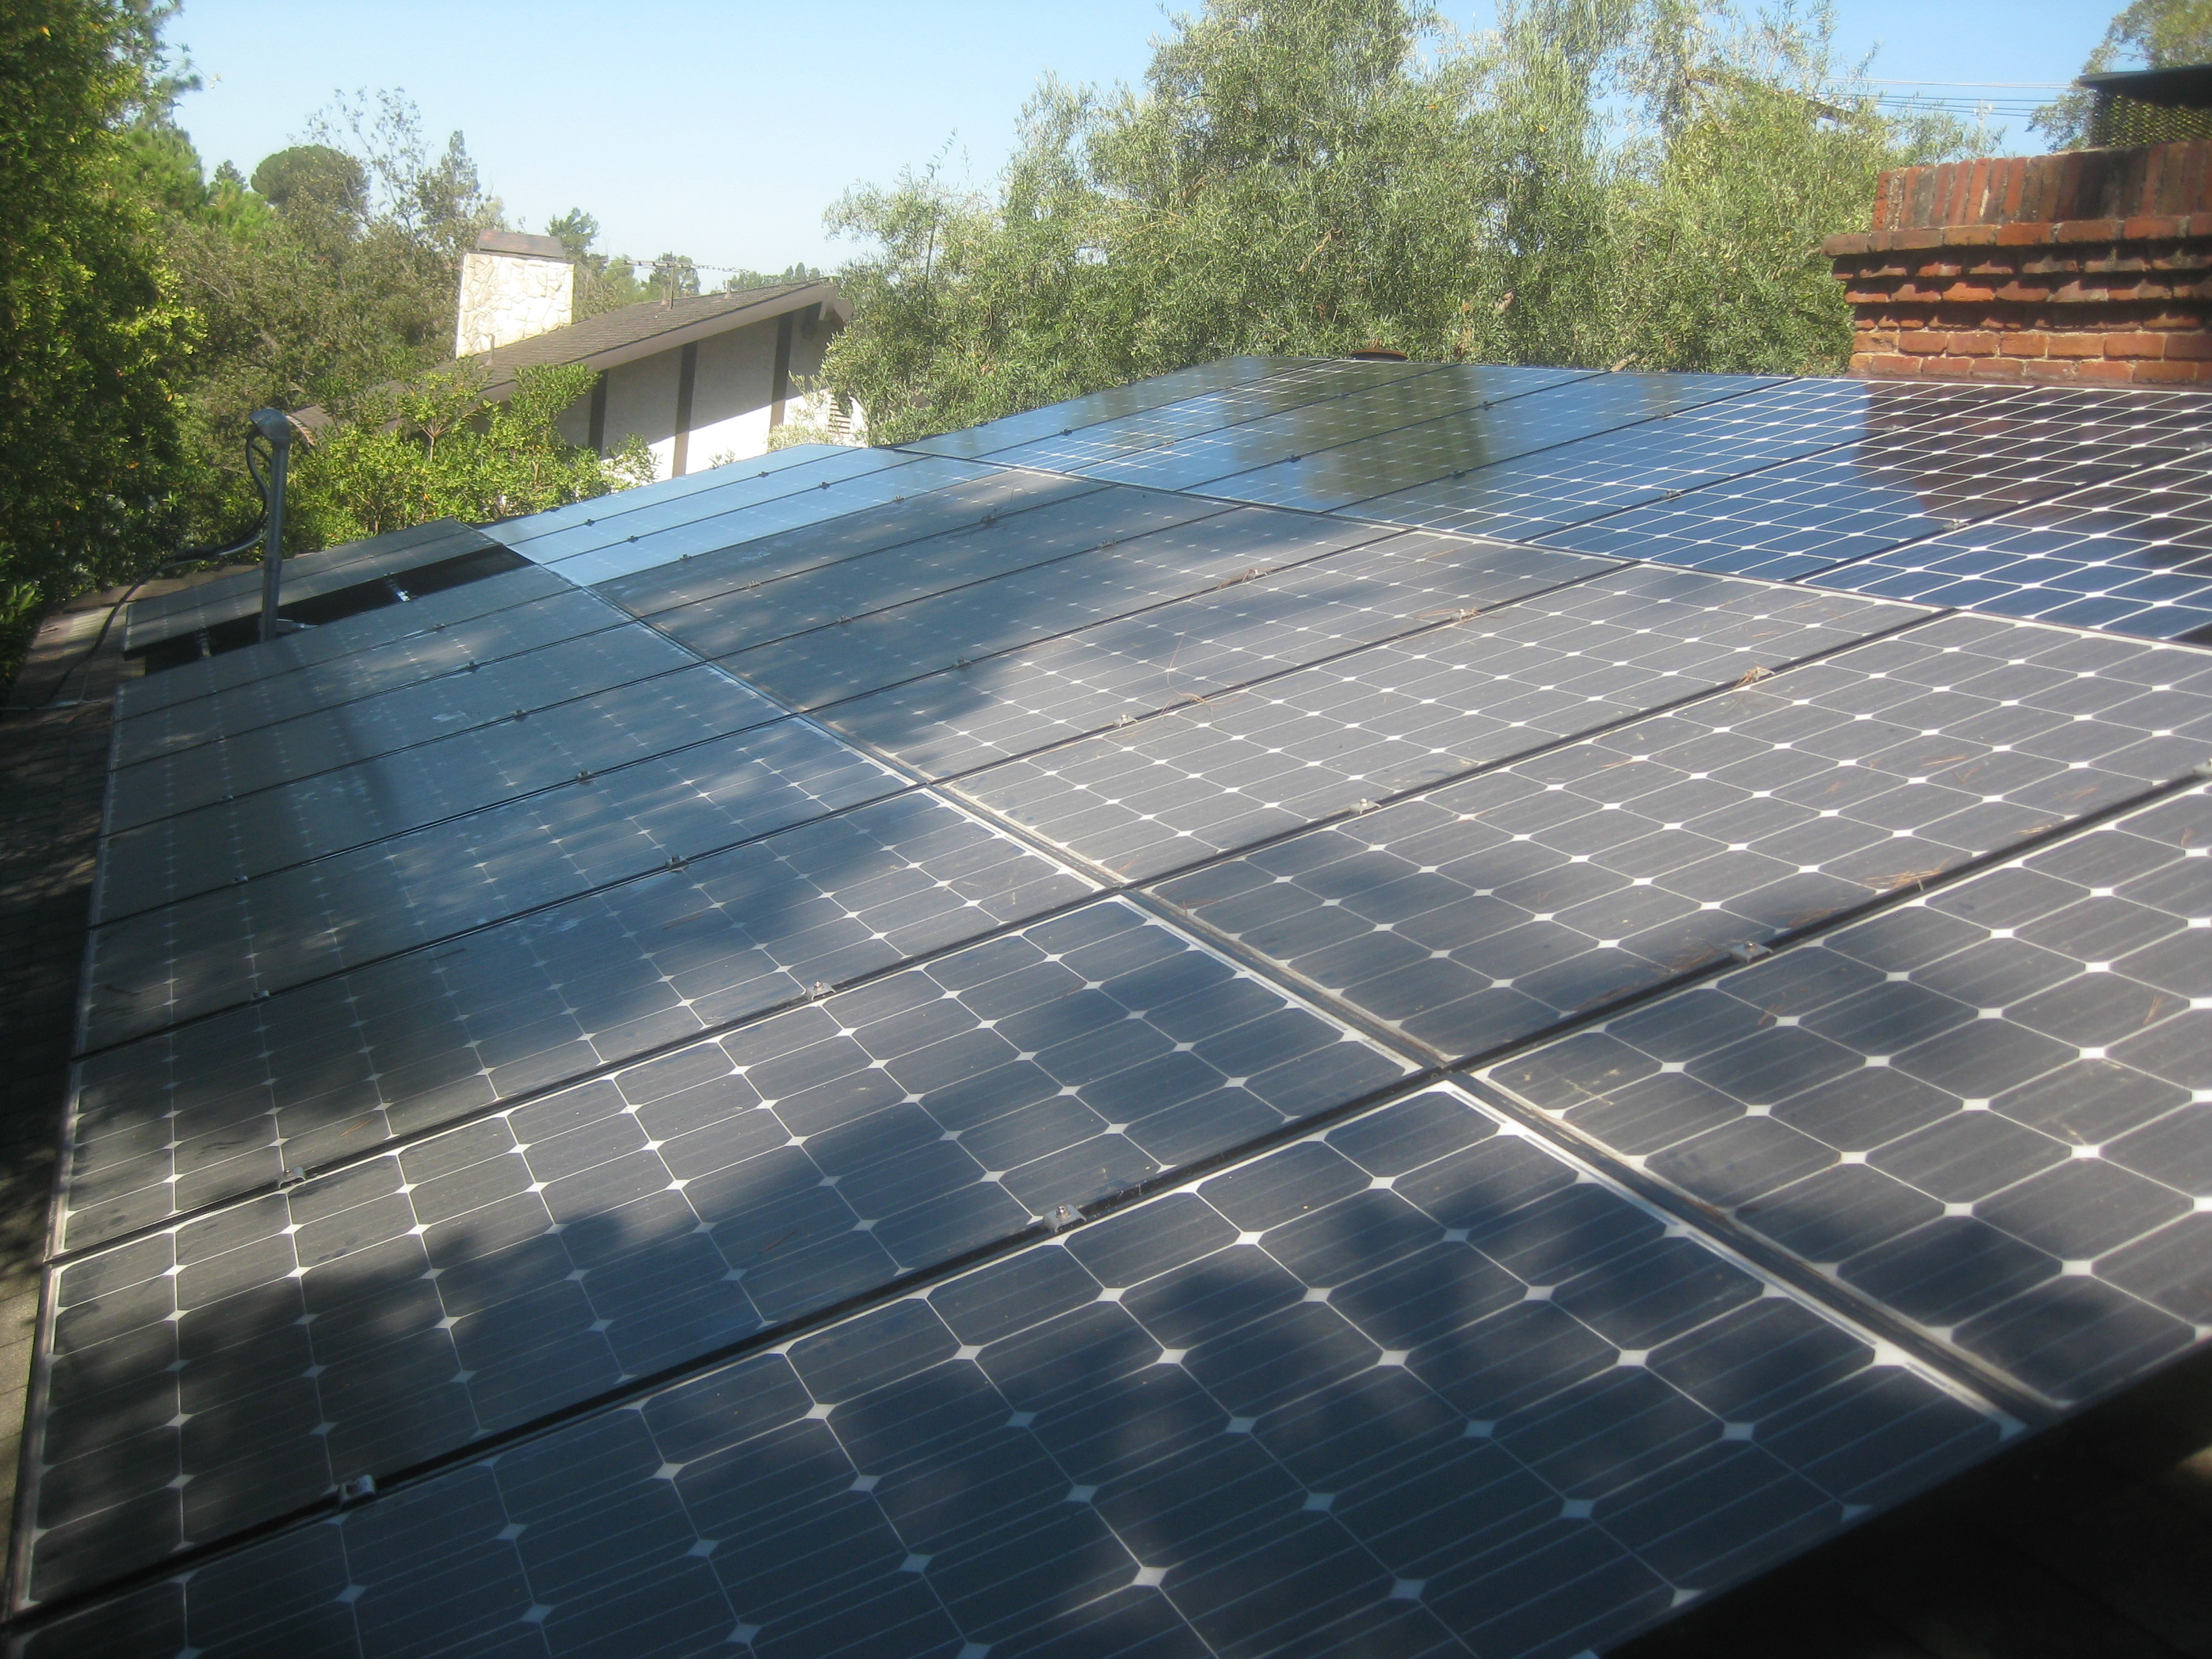
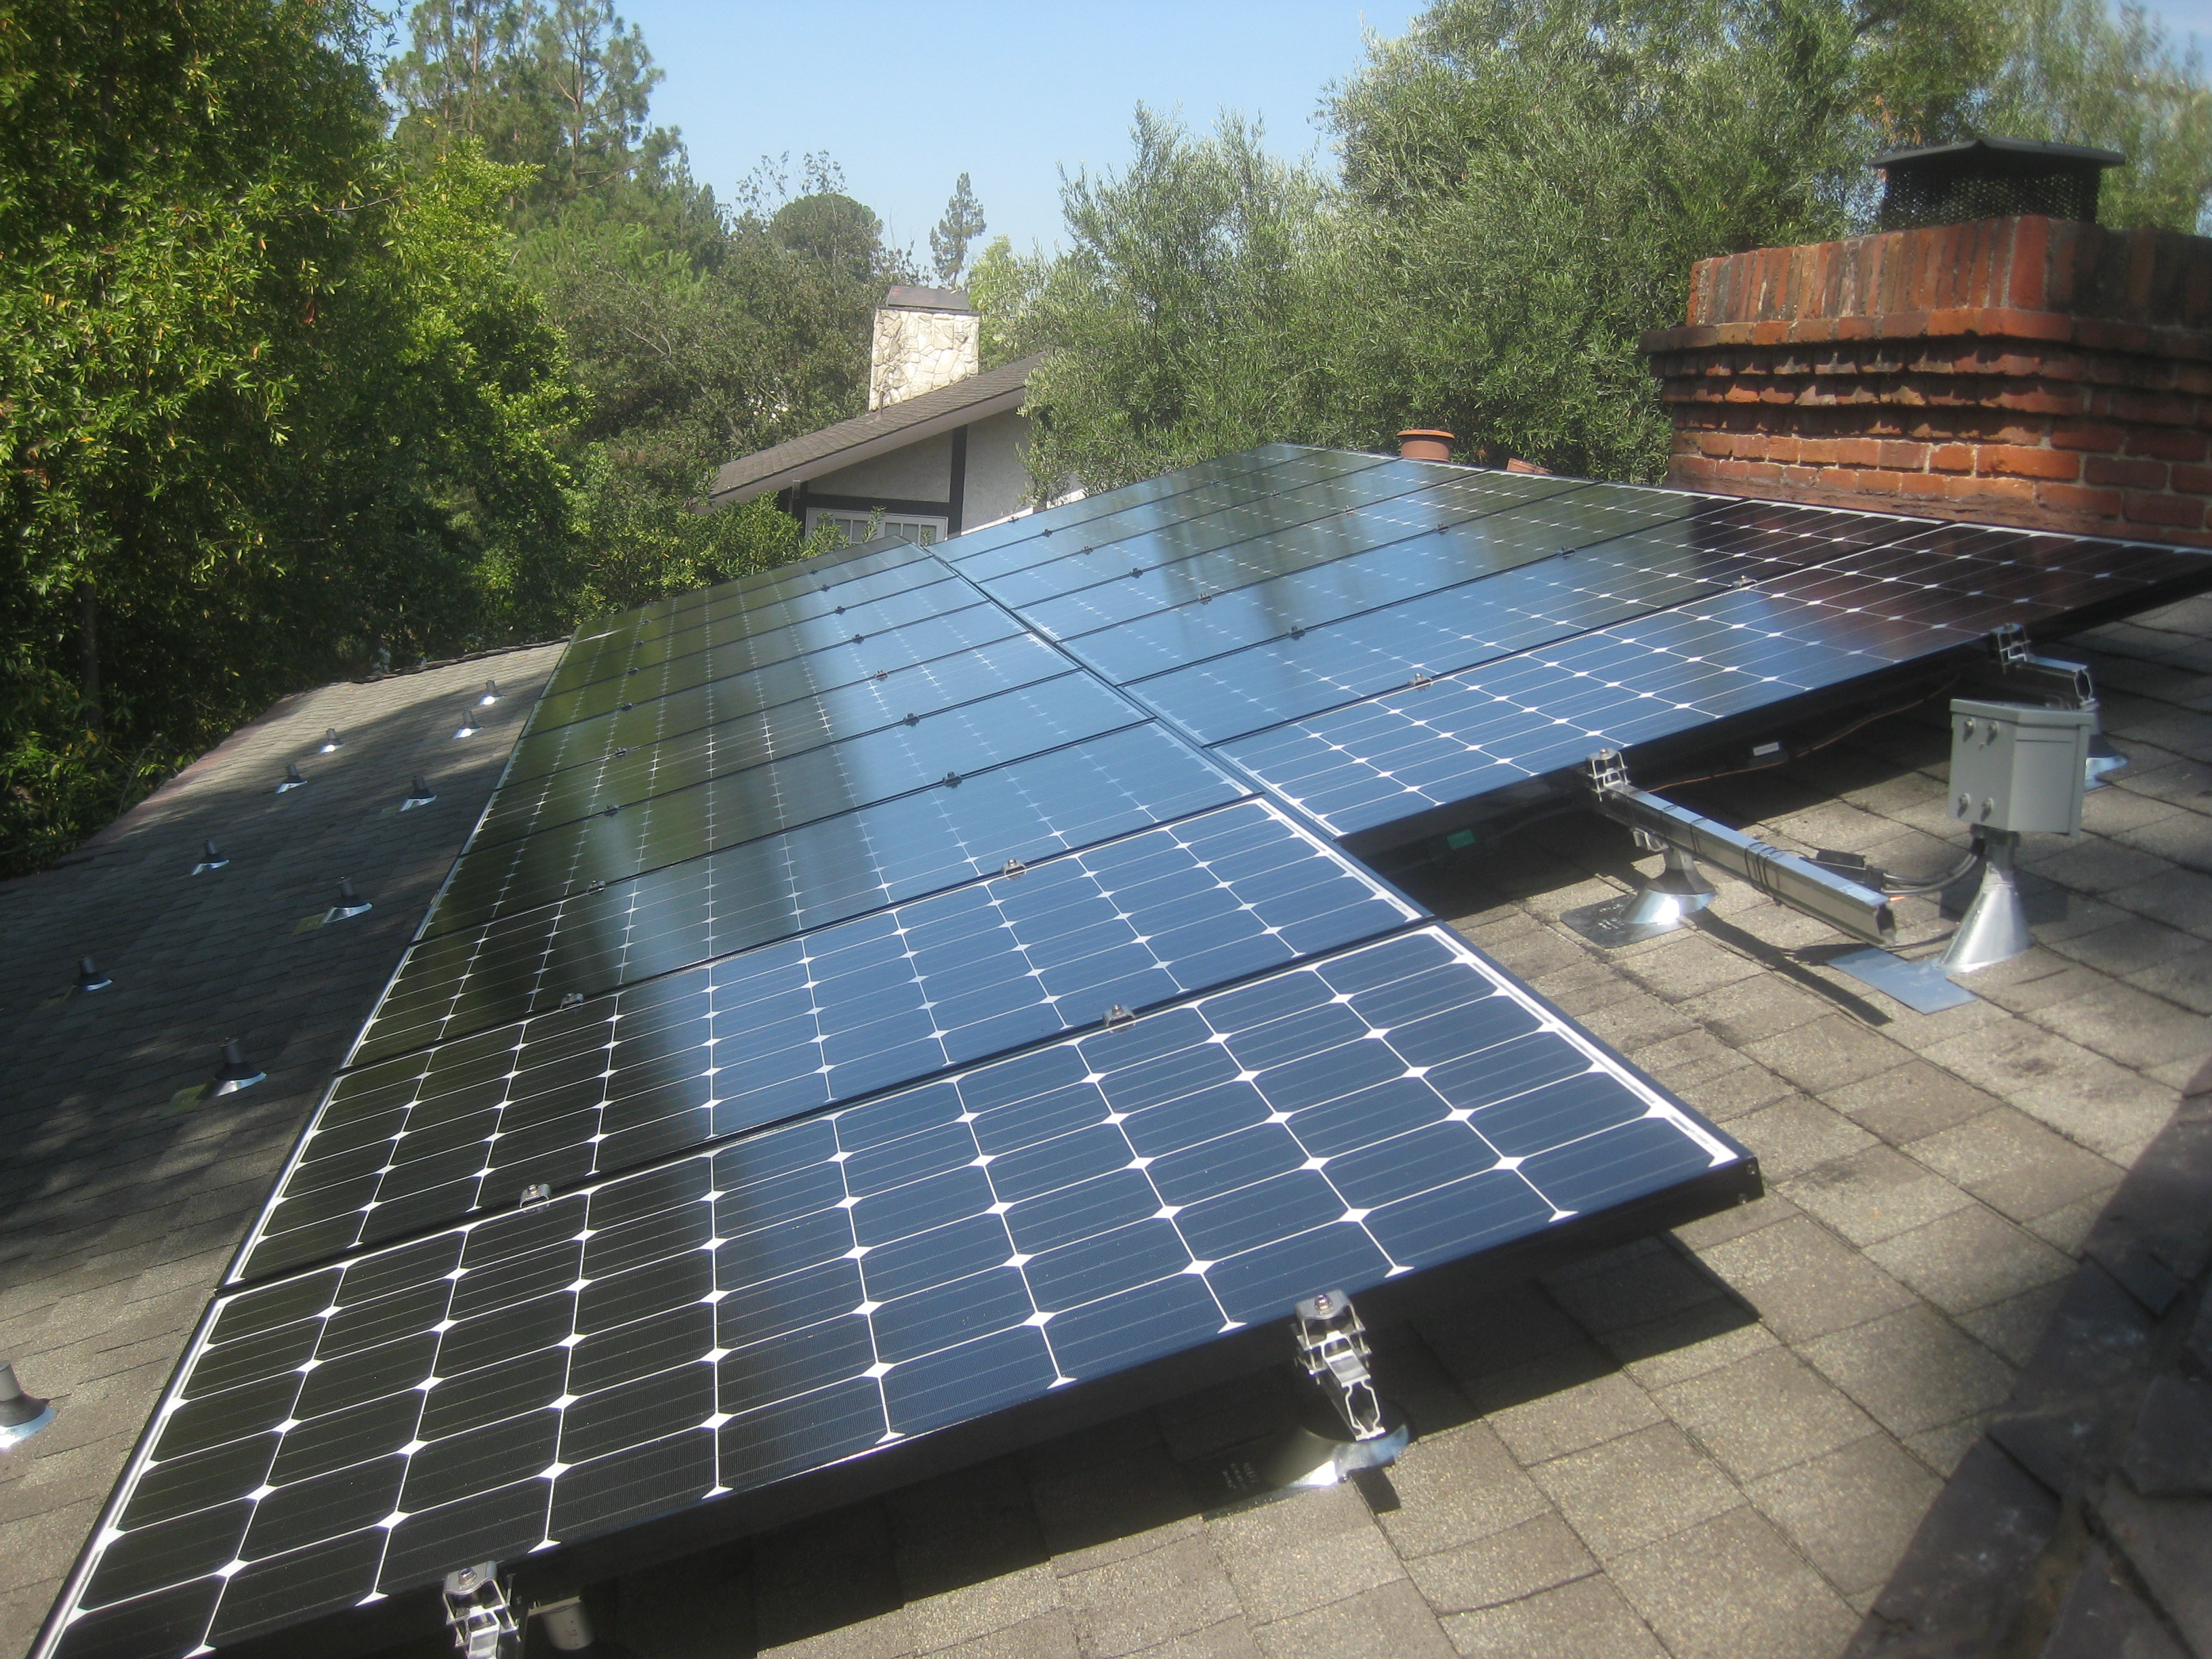
Try Doing That with a String Inverter!There is a vigorous debate among solar installers about the relative merits of microinverters, such as those made by Enphase Energy, versus those of string inverters, such as those made by SMA. We can't claim that we have resolved that debate once and for all, but our experience this past week reaffirms our confidence in the microinverter choice. Almost exactly a year ago we did a residential installation at a seriously shaded site. We explained in detail to the homeowners about the reduced yield that any solar power system would provide given just how much shading they had, but they were still eager to press forward. The shading mandated that we use microinverters, and they were excited to see how their system would perform using the Enlighten monitoring system. In addition to the shading, there was another limitation - a 150 Amp service meant that we couldn't install as big a system as they needed. However, they were about to embark on a six-month renovation of the home and as part of that they were going to upgrade the service. We decided to build the first half of the system right away and include the additional infrastructure that would be needed for the later addition - down to the standoffs on the roof. Here's how the install looked a year ago:
Fast-forward to this past week. We are still using M215's but LG has moved up the curve and the new modules for the second phase of this project are 280 Watts each. The homeowner wanted the higher power modules incorporated into the existing system, and they wanted them installed not on the open bottom row, but wherever they would be able to get the greatest amount of sun to maximize their return on investment. The first great advantage of having microinverters on this project then was the ability to combine significantly different power modules into the same array. But the second goal - placing the new modules in the ideal locations - was one that we could only solve with confidence thanks to the Enphase Enlighten data. Indeed, all we had to do was go to the monitoring page for this site and request the display of lifetime energy. Here's how that looked:
Here is how the expanded array looked after we completed the install:
Here is how the new system performed yesterday (after the old panels were cleaned!):
Trying doing that with a string inverter! |
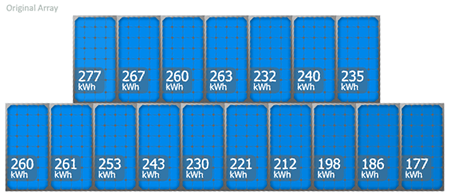 Now isn't that interesting? There is a huge difference going from the NW corner down to the SE. Overall, taking the top row along with the three west-most modules from the second row seemed like our best plan.