Welcome to the
Run on Sun Monthly Newsletter

In this Issue: |
September, 2012
Volume: 3 Issue: 9
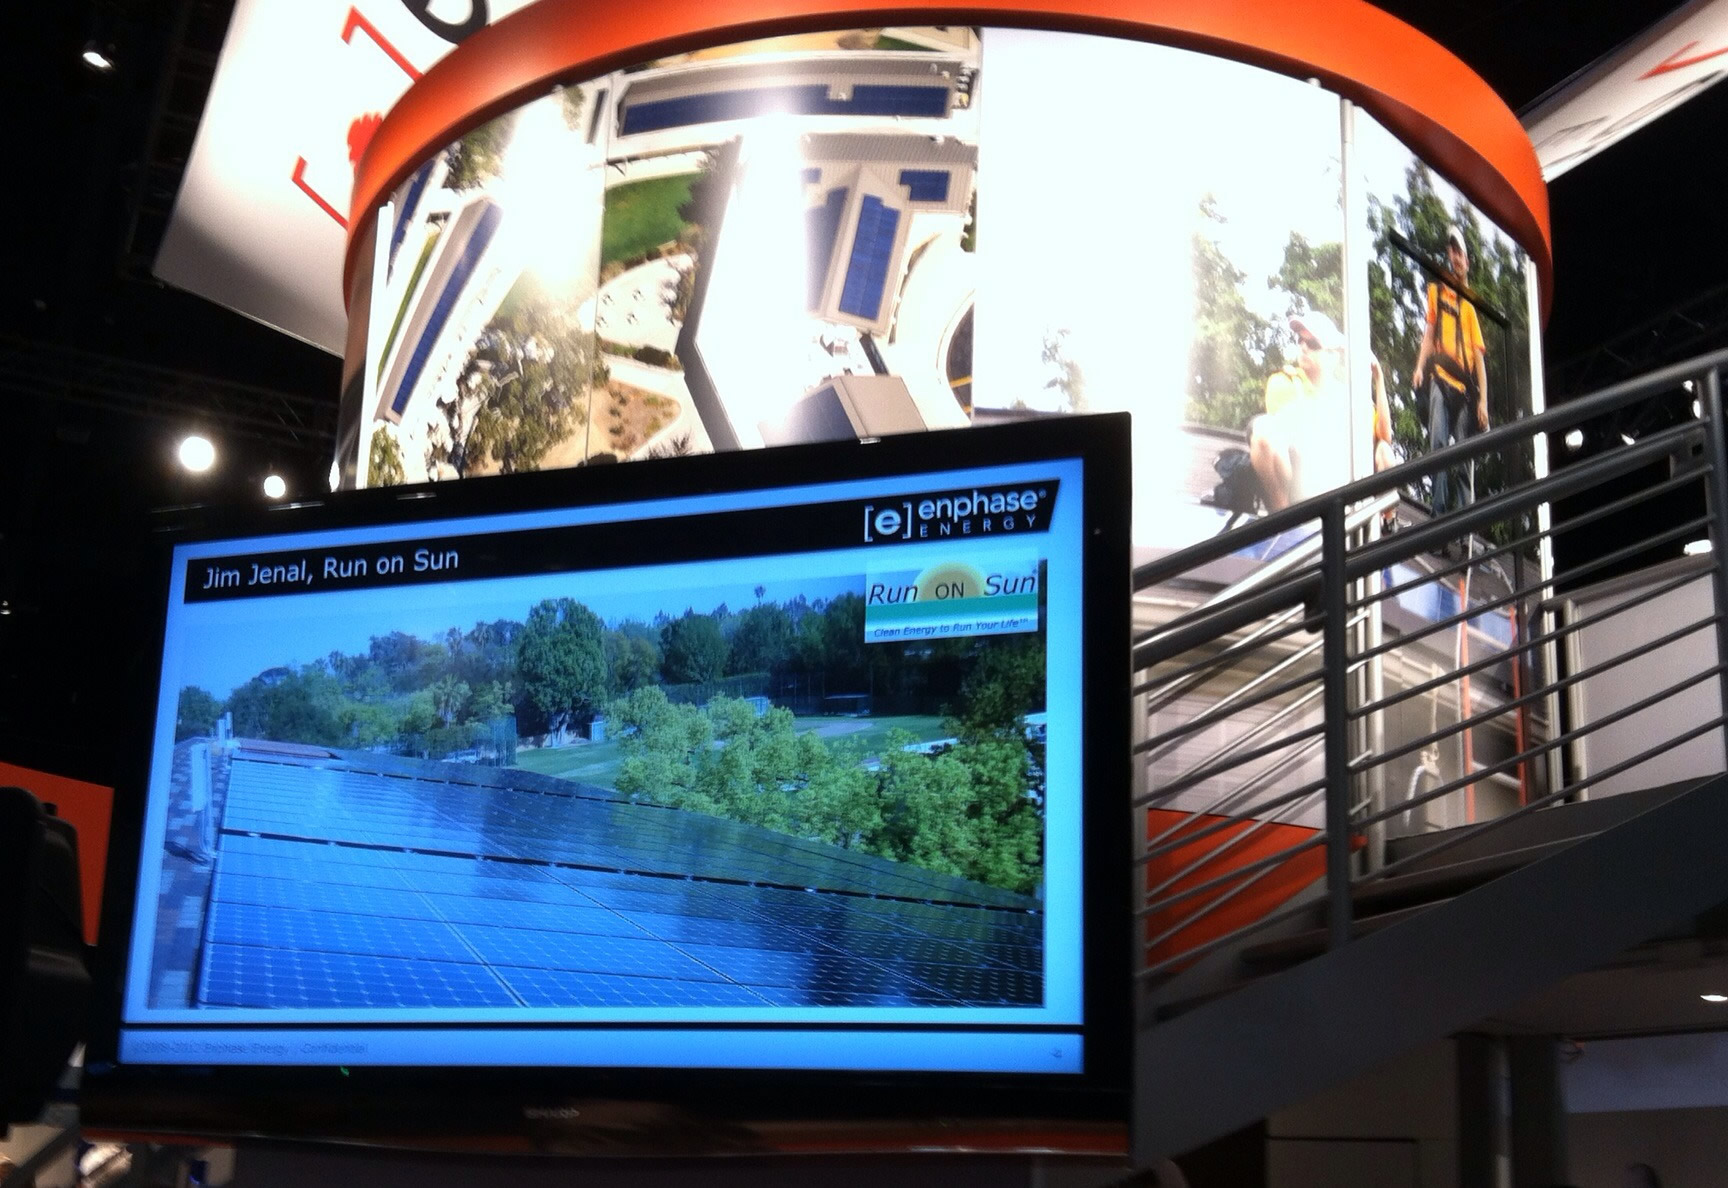
Solar Power International 2012 RecapWe spent last week at Solar Power International in Orlando thanks to our friends at Enphase Energy - here is our recap. Rocking with Enphase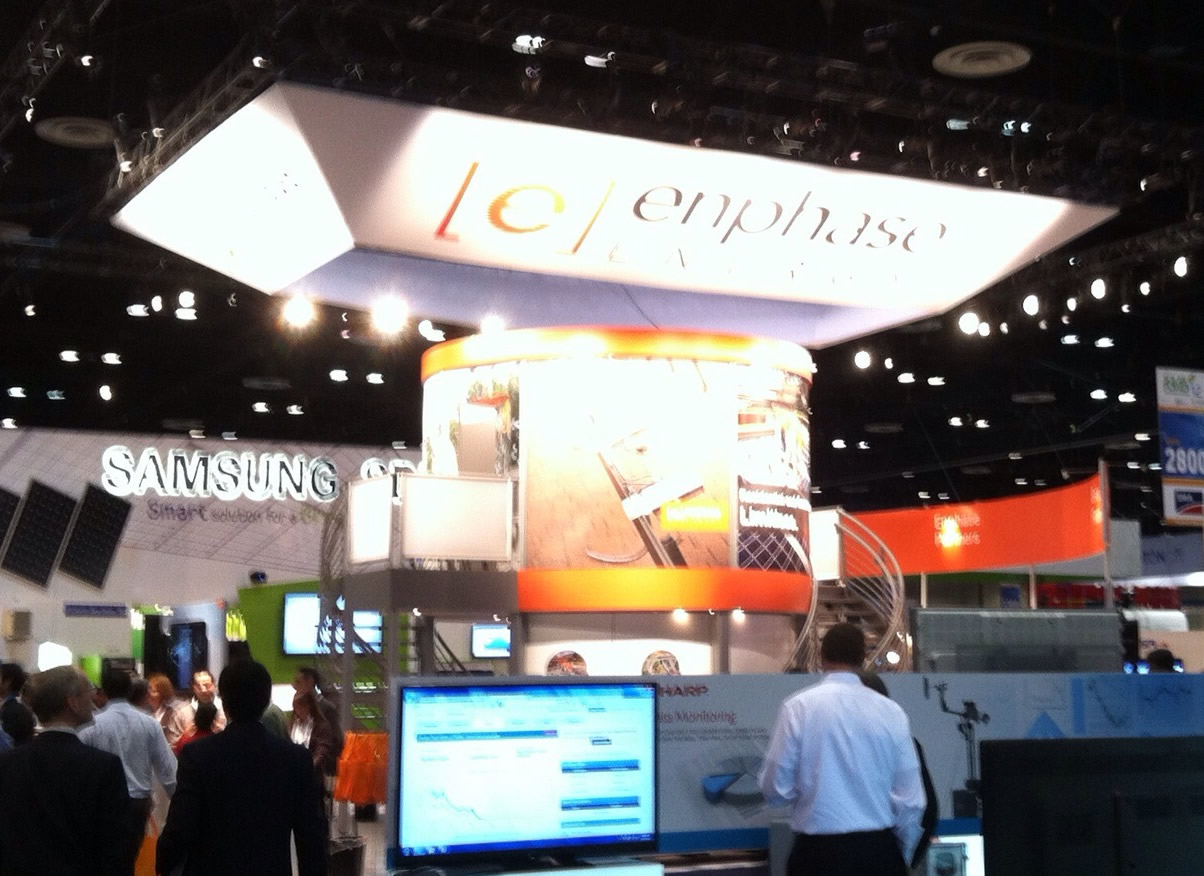
As we noted in our pre-show post, we were invited to attend SPI this year at the invitation of Enphase Energy, the company behind the most successful (but certainly no longer only) microinverters on the market. This was our second consecutive year at SPI courtesy of Enphase and a better host could not be found. Last year we were part of their Installer Challenge where six installers from around the country participated in a good-natured competition to demonstrate how easy it was to install the Enphase M215 product with its plug-in cabling. We didn't know it then, but very soon we would be installing more than 200 M215's on the Westridge roof, and in doing so, earn our second invite.
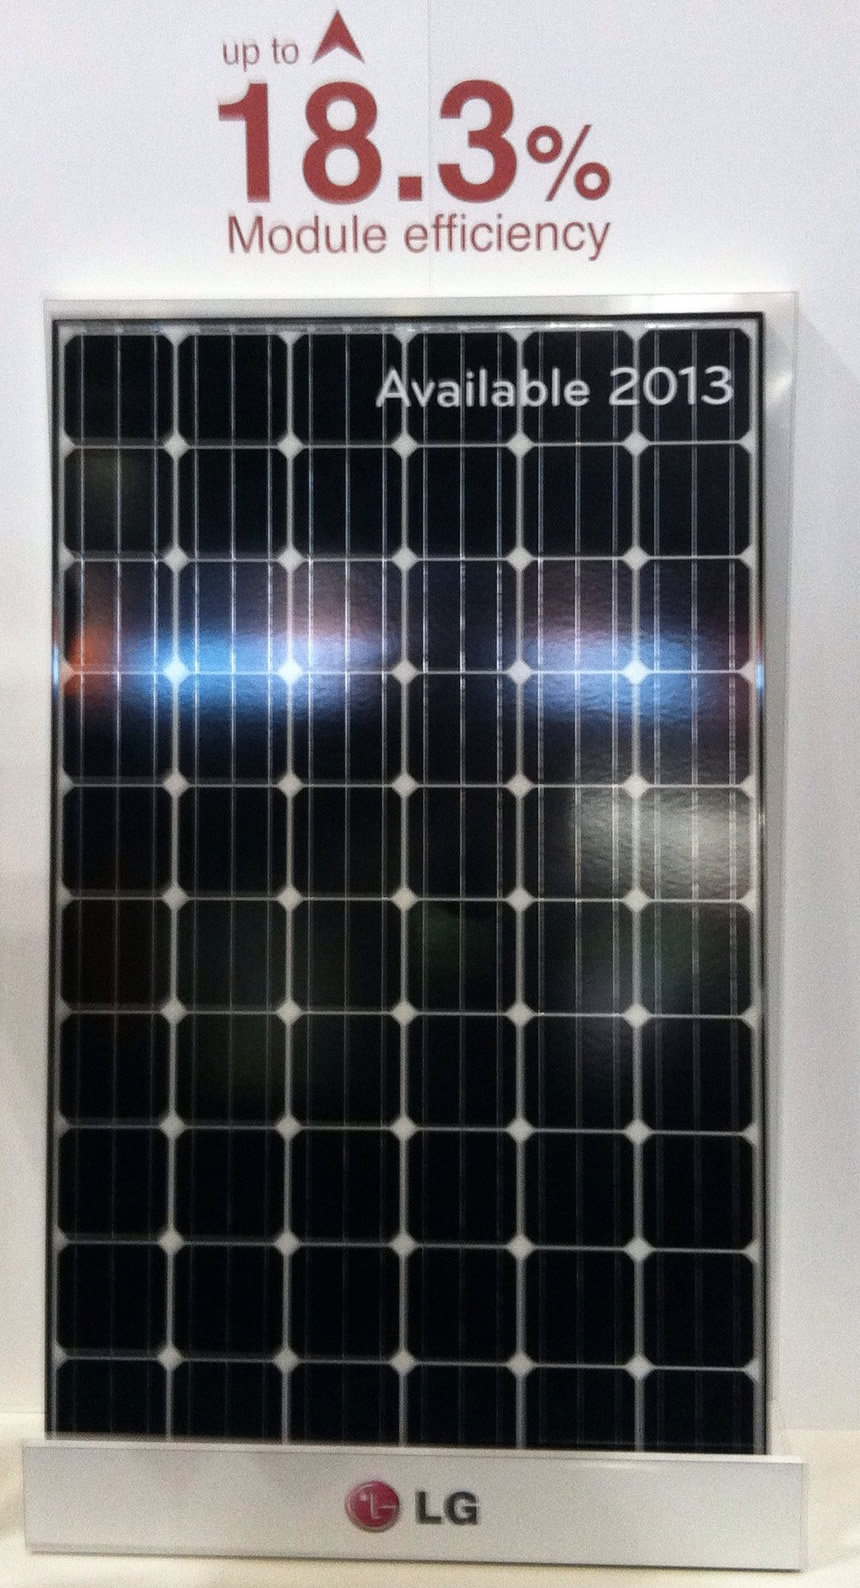
Having achieved substantial success in the residential market, Enphase is working very hard to make in-roads in the commercial sphere - and thus our install at Westridge fit nicely into that narrative. We participated in a panel with a group of other installation companies that have also incorporated Enphase into commercial projects and we did a pair of one-on-one interviews that showcased the Westridge project and our experience using Enphase. We also got to speak to a fair number of visitors to the Enphase booth (which was always crowded) and we even got a sneak peak at a prototype of the next model (which we can't comment on now, except to note that some installer-requested features will be included - stay tuned!). It was a great way to see the show and we can't thank Kady Cooper and everyone at Enphase enough - you folks rock! Oh, and one other point. Pretty much every large company at the show hired local "talent" to help host their booth. Most companies that do that, seem to think that it makes sense to have these women wear outfits that are more akin to what you would see on a dance floor than at a solar installation. As the father of a 16-year-old daughter, it was really satisfying that the two women who were brought in by Enphase to help host their booth wore outfits just like all of the other Enphase employees. Another example of how Enphase Energy is a class act. Stars of the Show?LG Bounds Up the Learning CurveWe wrote last year about the introduction of LG Electronics into the U.S. solar market and this year they became our "go-to" panel of choice for working with the Enphase M215 micros. Well it is now apparent that LG is paying attention to their feedback as they had a couple of significant announcements. First, their existing panel products, notably the 255 Watt panel that we will be using for the rest of the year, is getting a frame redesign that will make the overall panel 11% lighter without sacrificing strength or durability. Also, the panel now has clips on the back side to hold the panel leads in place so you cannot have them getting crushed by the panel frame when you stack them prior to installation. These are relatively minor changes, but they show a great attention to the type of details that make an installer's life easier, and even safer.
President Clinton Rocks the HouseTo be sure, the biggest hit of the conference was the speech delivered by President Bill Clinton, fresh off his tour-de-force at the DNC the week earlier. President Clinton did not disappoint, taking on the new role of Cheerleader-in-Chief.
"You are going to win this fight," the President insisted, "the only question is when and how." What was needed was for solar to reach the sort of "tipping point" which would make that ultimate success inevitable. But we certainly aren't there yet, which is a shame given that "the United States leads the world in its potential for solar so we must also lead the world in installed capacity - but we are not." A lot of that is a reflection of different policies between countries that have adopted solar with gusto, like Germany, and the more tepid policy response of the U.S. But those of us in the solar industry are in the "future business" and "you have to take risks if you are going to go to tomorrow's dance." We should embrace those risks because we are in such a fortunate position:
Thanks for the encouragement, Mr. President, we're working on it! Read the complete story - including our exclusive awards for Worst in Show by following this link. |

“You [in the solar industry] get to get up every morning, look at yourself in the mirror and say, ‘Today I'm going to do something great!’
You just have to keep doing it until we reach that tipping point.”
President Bill Clinton
Help Us Spread the News!


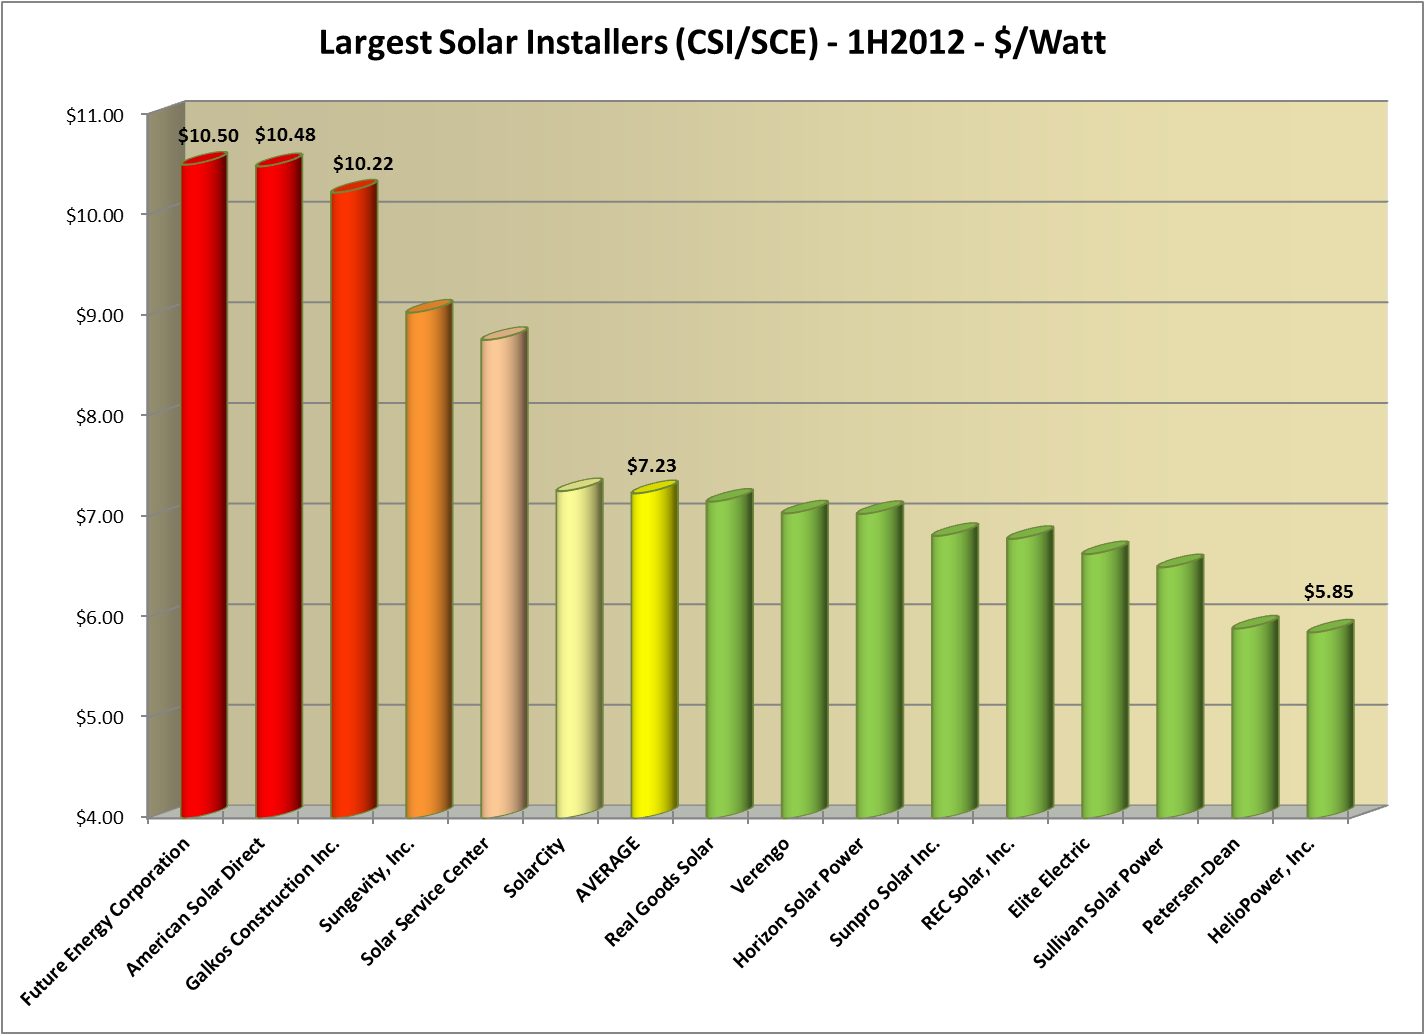
Outliers & Oddities - State of SoCal Solar 2012(Note: This is the third installment of our annual three-part series illustrating the State of SoCal Solar. In Part 1 of this series we laid out our data methodology and showed some of the general trends in the costs of solar power systems in Southern California Edison (SCE) territory for the first half of this year. Part 2 built on that to determine Who was Hot and Who was Not - and of course, being identified as Not Hot is certain to generate a lot more consternation than the other way around!) Now we turn our attention to some curious things that we have found in the data: Outliers who are charging way beyond any reasonable amount compared to their peers, or taking interminably long to complete projects, and Oddities - curious trends that defy easy explanations but raise questions about the State of Solar in Southern California. OutliersLast year when we analyzed this data, we discovered that there was one company that really stood out for being a bad actor when it came to over-charging on solar power systems. That company was Galkos Construction, coming in at a staggering $13.32/Watt compared to an average of $8.91/Watt, nearly 50% above the average. (We also noted that HelioPower, Inc. was the lowest in our analysis, coming in at just $6.56/Watt or 27% below the average.) What will we discover in this year's data? First a reminder of how this analysis works. Our focus is on systems in the residential market segment since that is the bulk of sales and also where consumers are at greater risk of being pressured into a high-priced sale. (If you are installing a 500kW solar farm and you don't do your homework, we have somewhat less sympathy for your plight.) Moreover, since the residential segment in the CSI data is limited to systems between 1 and 10kW, there is not as much size difference to skew the pricing data. We excluded systems that were "delisted" so only completed or pending projects are counted. We included, as we did last year, both cash sales and leased systems (although that data has gotten more interesting as we will see later) to capture as many data points as possible. That subset of our data accounts for 8,977 systems with an average system price of $7.23/Watt (CSI Rating). Finally, since we really only wanted to look at the behavior of the biggest players, we limited our analysis to only those companies with over 500kW of residential projects in the data. As a result, no company had fewer than 80 projects on our list, and the largest had nearly 1,800! These are big players indeed, and they should be able to demand tremendous pricing for their components - but do they pass those savings on to their customers? When we apply this restriction to the data, our sample size is reduced to 6,095 systems (68%) with an average system price of $7.38/Watt - roughly 2% higher than the overall average! Here are our results:
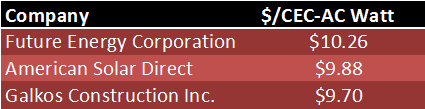
The bulk of our companies here, 9 out of 15, come in below the overall average for this group. And once again, our friends over at HelioPower came in with the lowest system price at just $5.85/Watt. Nicely done, for the second year in a row! (Full disclosure - while none of our projects were in SCE territory during this period, our system price for the first half of 2012 was just $5.33/Watt.) True Outliers: Future Energy, American Solar Direct and Galkos Construction (Again!)While down significantly from the stratospheric heights of last year, three companies continue to soar past the $10/Watt threshold: Future Energy Corporation, American Solar Direct, and just like last year, Galkos Construction, Inc. Each of these companies is $3/Watt above the average for the residential market segment. To what can we attribute these crazy prices? Future Energy and Galkos use Enphase microinverters (but so do we, and our prices are approximately 1/2 of theirs) and in any event, American Solar Direct uses SMA exclusively, so inverter price is not driving these costs. What about panel choices? No insight there, either: Future Energy uses SunPower, but American Solar Direct uses REC and Galkos uses Sharp (and each uses that brand over 90% of the time). And they each bought a lot of panels: Future Energy bought 3,091, American Solar Direct bought 6,329 and Galkos bought 7,759. Surely that much purchasing power can demand tremendous cost reductions to these companies. Equipment choices are simply not driving these prices. Cost Caps?The CSI program has talked about cost caps for a long time, and in the latest published CSI Handbook (from December 2011) we find this provision:
Now this cost calculation is somewhere between the number we are using (which includes the design factor) and the nameplate cost (which is what solar companies typically report because it is the lowest and it also masks differences in equipment value). What would happen if we were to re-jigger our cost values for our three Outliers to present their system costs as defined by the CSI Handbook's Cost Cap section? Here are the results:
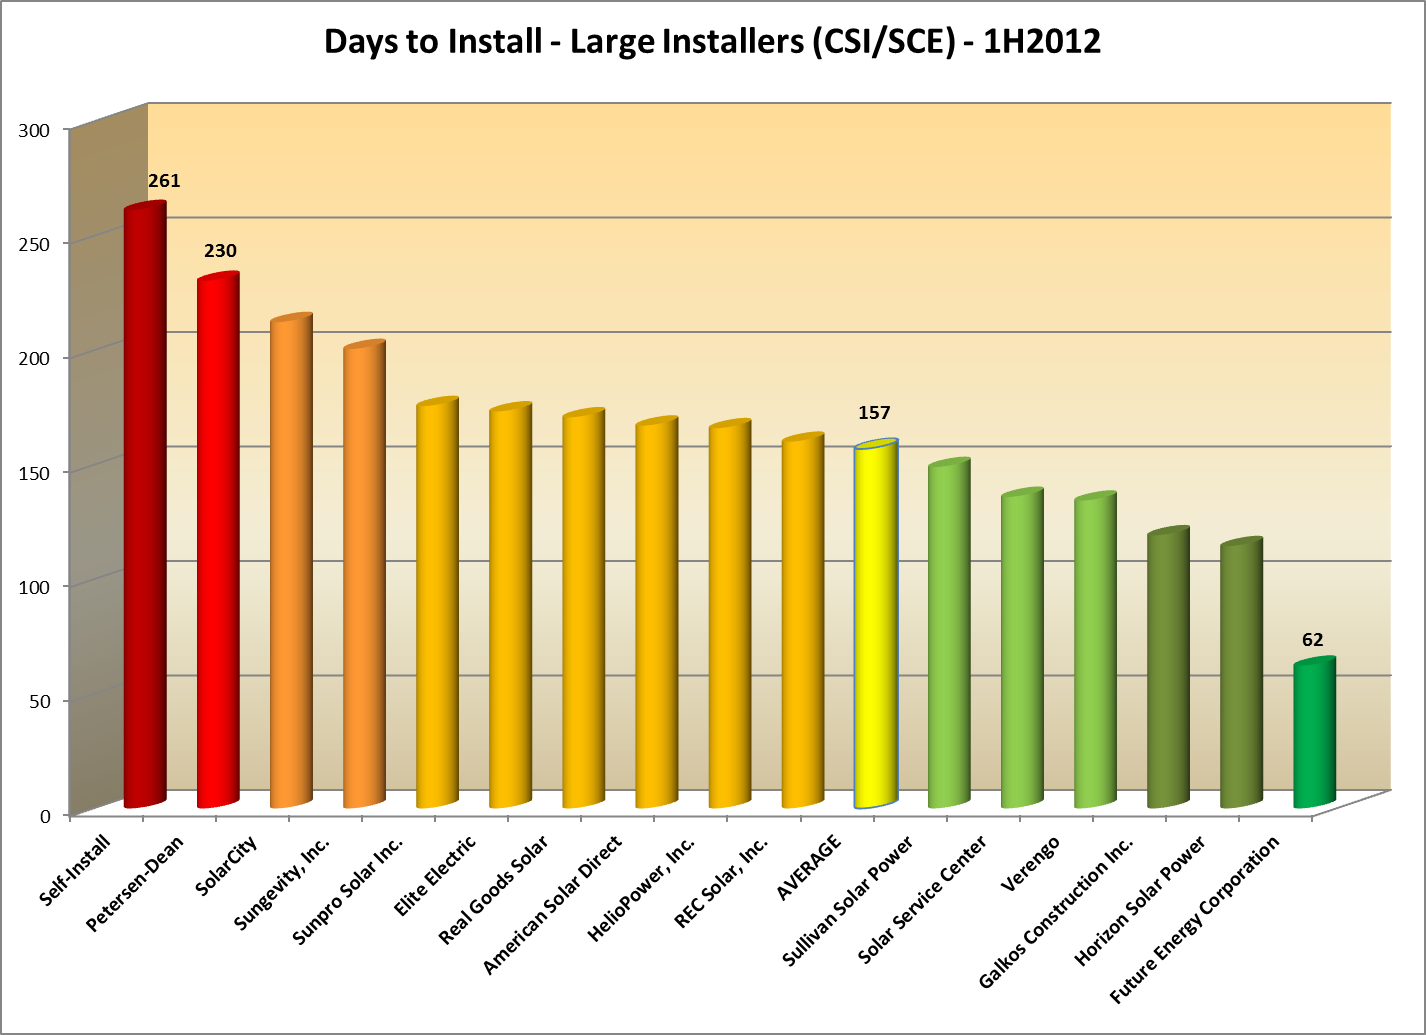
What do you know about that? Future Energy's average price is exactly at the limit stated in the CSI Handbook to avoid scrutiny by the Program Administrator! What a coincidence! To be sure, all three of these companies exceeded the $10.26 threshold: Future Energy (99 out of 171 times, 58%), American Solar Direct (68 out of 291, 23%), and Galkos (170 out of 482, 35%). What to make of that? For one thing, it shows that Cost Caps work - despite being dollars above the average cost of their peers, they each managed to at least have their average value remain under the cap. For another, perhaps it would be useful if CSI published those companies that routinely exceed the Cost Cap in a given period? If nothing else, it would help put consumers on notice in ways that they presently are not (unless, of course, they are reading this blog). We would love to hear from Future Energy, American Solar Direct or Galkos, and we will be happy to print their explanations for these prices unedited, and in full. (Of course, those responses are subject to further analysis.) Not So FastAnother type of outlier is the large solar company who signs a contract and then disappears for months on end while the customer waits, and waits, and waits (cue the Casablanca sound track). For our same set of big time players, we decided to rank order them by the average time to go from the first filing of a rebate reservation request to the first completion date. While there are lots of reasons for any one project to get delayed, for companies like these that install such a huge percentage of all systems, you would expect to see quick and efficient operations that deliver quality systems in short order. Here is what we found:
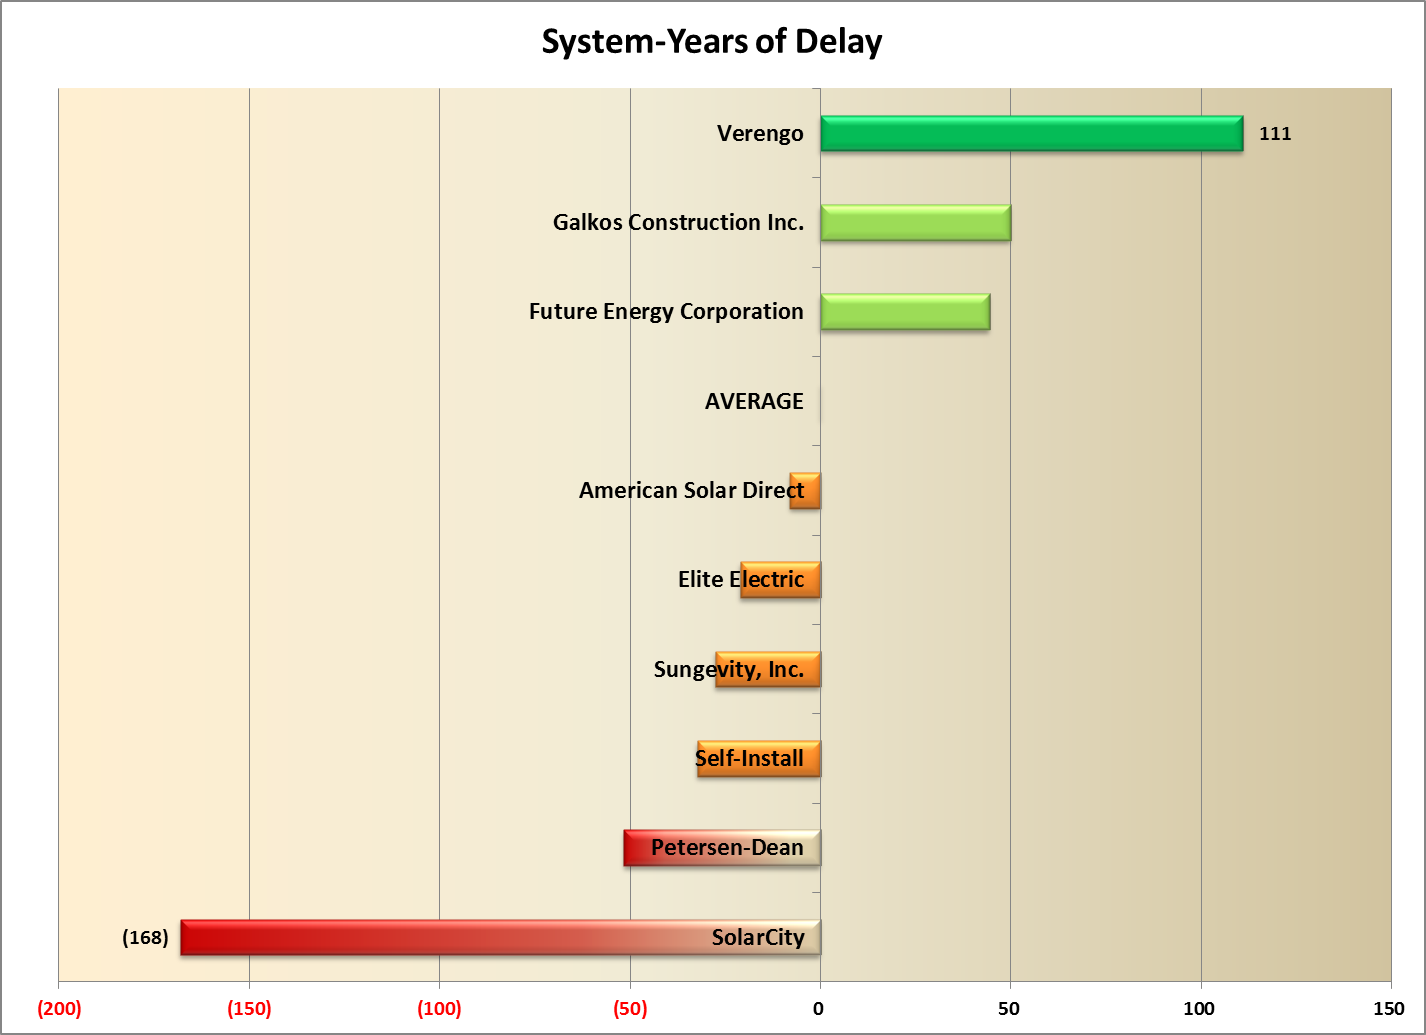
(Wow - Do-it-Yourself'ers take the longest to get their systems built - who would have guessed? Yet another reason why solar is not a DIY project!) Now isn't this interesting - Future Energy has the shortest time to install of all of these companies, taking roughly half the time to complete a project as its nearest competitor. Maybe Future Energy customers are getting something for all of that extra money! (Although a little research might reveal some cheaper, faster options...) The average - which most of these companies cluster closely around - is still in excess of five months, far longer than most solar customers expect to wait. But two companies - Petersen-Dean and SolarCity - have delays in excess of 7 months! Perhaps being a huge company, like SolarCity, makes it harder to be responsive, but what is Petersen-Dean's excuse? They have 257 systems in this sample (compared to the 1,108 for SolarCity), not that many more than the 171 of our speediest company, Future Energy, and nowhere near the number of systems for Verengo which is actually doing better than the overall average at a delay of 134 days. This got us to thinking - if we take the average number of days to complete as our benchmark, some companies will be working better and some worse than that average. In other words, some companies are insuring that solar systems are installed faster, whereas others are, sadly, causing systems to be installed slower. What is their cumulative impact? To measure that, we came up with a new metric which we have dubbed the cumulative System-Years of Delay, or SYD (see Notes at end), which is the product of the total number of systems attributed to a company times the difference between the overall average time to complete and the time for this company, divided by 365. Companies that install faster than average under this metric will have a positive value, slower companies will be negative - thus the goal will be to have the largest value possible. Think of this as whether a company is propelling the overall solar industry forward, or dragging it backward. Here are our results (companies clustered around the average have been deleted for clarity):
This is a startling result - the two giants of the industry, Verengo and SolarCity, are at opposite ends of this scale! Verengo, which has 1,791 systems in this subset, averaged 134 days to complete a project, 23 days better than the average for our major players. Thus, it is propelling the installation of solar forward since it handles so many systems faster than average. (Future Energy is way faster still, but has a small impact by comparison because it only installs a tiny fraction of the systems Verengo is handling.) To be sure, Verengo's 134 days is nothing to brag about, but in this crowd of relative slow-pokes, Verengo is clearly leading the way. So what can we say about SolarCity? Well, first, they are really slow - taking on average nearly two months (55 days) more than the overall average (of five months) to get a system installed. (As with the fastest company comparison, Petersen-Dean takes substantially longer than SolarCity - 73 days worse than average compared to 55 - but they account for far fewer systems - 257 versus 1,108.) But more importantly, SolarCity's delays become a real setback for the overall industry given the large number of systems for which they are responsible. Look at it this way: SolarCity, just in this tiny slice of data, representing just a fraction of their overall industry impact, is responsible for the installation of 1,108 systems representing a total capacity of 5.5 MW of residential solar. Assuming an average of 5 solar hours per day, for every day that SolarCity delays installing these systems, 27.5 MWh of energy is not being produced. Factoring in their 55 day delay beyond the average of their peers means that 1.5 GWh of energy was not produced, and instead, 498 additional tons of greenhouse gases were emitted (see Notes at end). SolarCity's delays are bad for the solar industry, and bad for the environment. OdditiesWhich brings us to the Oddities section of this post. One year ago we stirred a bit of controversy by observing that SolarCity's system prices for leased systems were far higher than what they reported for cash sales. We thought this was odd because there was no similar discrepancy in the data for the other large player in the leasing space, Verengo. So naturally, we needed to revisit that analysis this year and see if that trend was continuing. Our analysis last year tried to focus on the most recent projects in the data, and so restricted the data set to just include "pending" systems, eliminating those that were installed or delisted. Last year, SolarCity charged $10.06/Watt for its 468 leased systems compared to Verengo which only charged $7.63/Watt for its 482 leased systems. Here's what this year's data reveals:
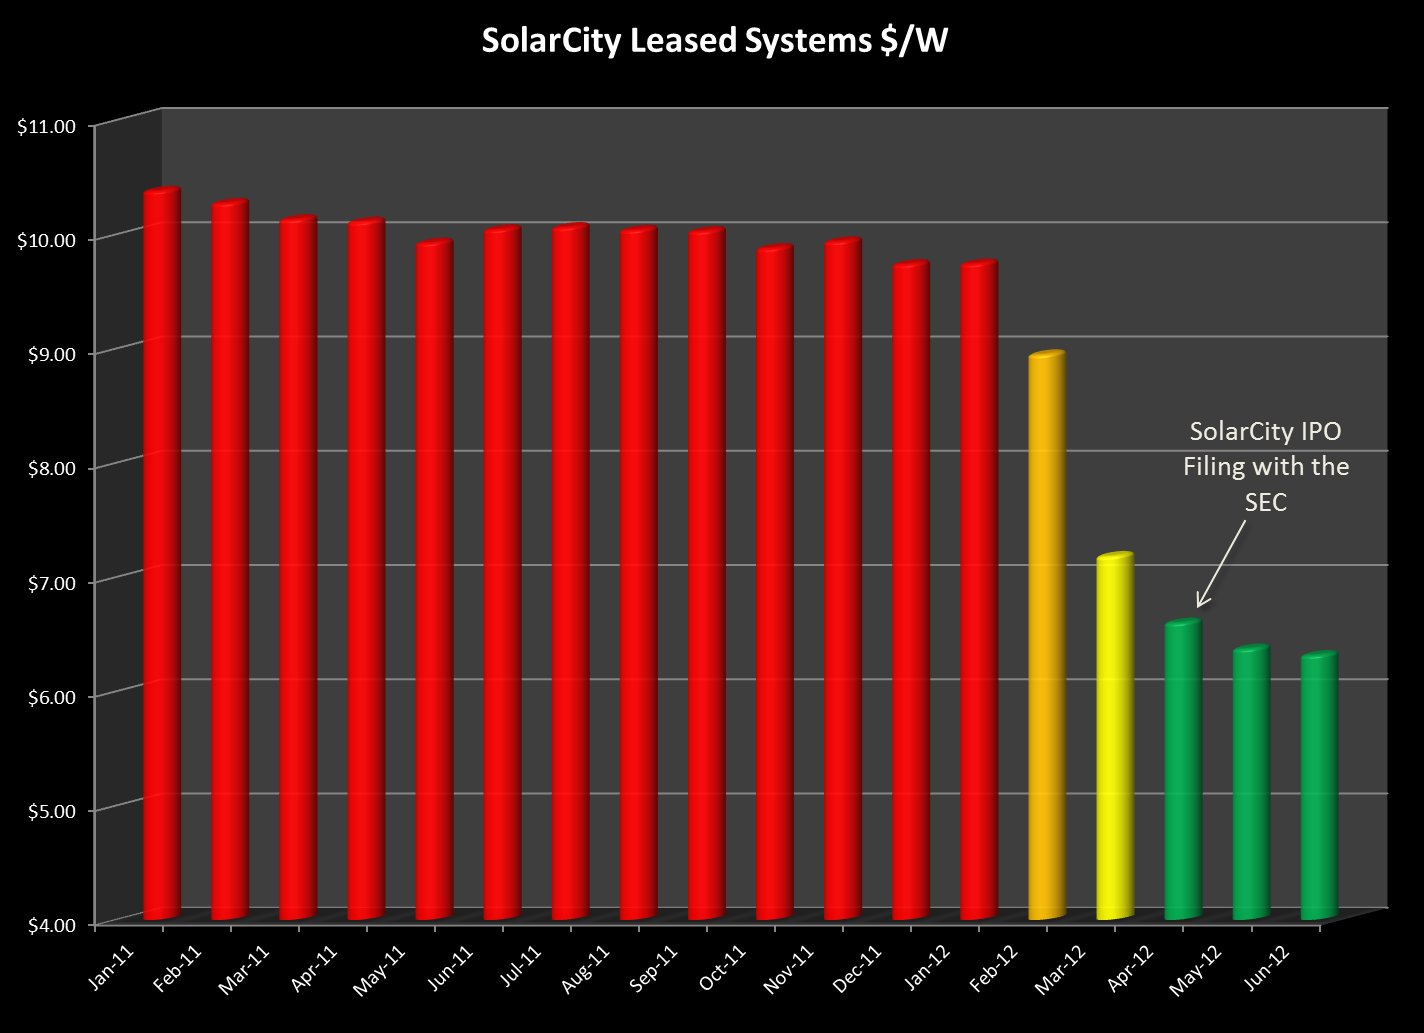
First some mundane observations: while Verengo has increased its number of pending systems from a year ago by roughly 45% (consistent with the overall growth in this data set from a year ago), SolarCity actually declined by roughly 24% and Verengo now has nearly twice the share of this segment as does SolarCity. But of course the shocking data point is SolarCity's cost per Watt - all the way down to $6.61, and now tied (exactly) with Verengo! This is a remarkable development given that the overall downward trend in prices over the past year was far, far more modest than the precipitous drop reported by SolarCity. We decided to investigate this a bit further. In particular, if the decline in SolarCity's pricing was simply that they were better able than most to take advantage of lower equipment prices, we would expect to see a gradual decrease over time from last year's high to this year's low. To test that hypothesis, we went back to the overall data set and expanded are analysis to look at all California data (i.e., including PG&E and SDG&E data in our analysis). In addition, because we needed to go back to 2011 data, we included completed projects (i.e., "installed" in the data) as well as pending projects. We then aggregated them by month and calculated the month-by-month average system cost from January 2011 to June of 2012. Here's what the data disclosed:
For thirteen months, from January 2011 through January 2012, SolarCity's system costs were remarkably stable - at or near $10/Watt. But then something amazing happened and in the space of three short months, SolarCity slashed its prices from $9.74/Watt in January to just $6.60/Watt in April - a drop of more than a dollar a Watt per month! Now our buying power is nothing compared to that of SolarCity, but we certainly didn't see price declines anything like that! And then we remembered something else that happened back in late Winter and early Spring (although the memory is a little fuzzy given that we haven't heard anything more about it since). From Bloomberg.com (April 9, 2012):
Rumor has it that the SolarCity IPO may have stalled over concerns by the SEC regarding those very accounting practices. If the need to "clarify" its accounting - specifically the manner in which it calculates the fair market value of its leased systems - is what is driving down this pricing it begs the question: Will SolarCity voluntarily revisit the accounting for all of its previously leased systems and refund the excess federal tax credits and depreciation that it has received based on what its present conduct seems to concede was an overstated valuation? Time will tell. NotesClick here to read the Notes for this post. |

Community Solar Bill Defeated - Wait 'til Next YearSB 843, the proposed law that would have allowed for Community Solar installations, has been defeated. Faced with unyielding opposition from Pacific Gas & Electric (PG&E) and Southern California Edison (SCE), the bill was killed in the Utilities and Commerce committee of the Assembly. Community Solar allows renters, home owners with undesirable roofs, or businesses that don't own their own buildings to "go solar" by owning a piece of the output of a community solar installation. Since a large percentage of potential solar clients fall into those circumstances, the concept of community solar is extremely appealing. (Over the years, we have had numerous potential clients that we have had to turn away because their site would simply not support a viable solar installation. These people would be natural participants in a community solar project.) Indeed, the list of organizations supporting the bill contrasts sharply with those opposing: Support for SB 843 (Wolk) Unfortunately, an appealing concept with broad support can still be extremely difficult to turn into practical legislation, and with the end of the session looming, there simply was not enough time to get this bill across the finish line - despite heroic efforts by many dedicated solar advocates. But I'm a Dodgers fan, and we are accustomed to the refrain, "wait 'til next year." Accustomed, but not resigned, that is. So next year, when this measure is re-worked and re-introduced, we intend to be on it from Day 1 and we will be encouraging all of you to make your voices heard early and often so that we can finally get this done. |