Welcome to the
Run on Sun Monthly Newsletter

In this Issue: |
June, 2012
Volume: 3 Issue: 6
CPUC Provides Progress on Net MeteringSay what you will about the California Public Utilities Commission (CPUC), but their recent rulings have been strongly in support of the solar industry and on May 24, they did it again. In a unanimous decision, the CPUC voted to increase the cap on net metering, overriding protests from some utilities and misguided "consumer" advocates. At issue was the manner by which the statutory cap on net metered installations was to be computed. Under existing state law, California utilities are obligated to accept net metering connections from solar power customers until the installed capacity of the utility's solar customers equals 5% of the "aggregate customer peak demand." The problem before the Commission was how to define the denominator: does aggregate customer peak demand mean the peak demand that the utility as a whole had seen (as the utilities argued) or was it the sum of the peak demand for each of the utility's customers? That turns out to be a very significant difference and the CPUC came down on the side of the solar industry. As a result, the total amount of net metered capacity under the law will now be computed to be 5.2 GW compared to just 2.4 GW under the utility's interpretation! However, the Commission didn't stop there. Part of the argument from the utilities was the claim - echoed by TURN - that net metering amounts to a "silent subsidy" from the general rate payer to more affluent customers who can afford solar. In their ruling, the Commission authorized a study to investigate that claim and to quantify the cost-benefits of net metering to the larger rate paying community. Unfortunately, there is also a downside to the Commission's decision - and some surprising data analysis as well. To see all of that, check out the full story at our blog. |
“As a result, the total amount of net-metered capacity will now be 5.2 GW, up from 2.4 GW!”
Help Us Spread the News!


Here’s Your Chance to Help Grow Run on Sun!
And that's where YOU come in! If you click on the enormous blue banner above, you will be taken to the program website. Once there, please click on the "Log in & Support" link on the bottom right. That will log you in via your Facebook account and take you to the search page. In the search box you can either enter "Run on Sun" or select Pasadena, California to see all of the companies from Pasadena that are competing (there's a lot!). Either way, when you get to the Run on Sun entry, please vote for us. That's all there is to it! To even be considered for the grant, we need to garner at least 250 votes and we need to do this before July 1.
So please, click right NOW! |
Solar Eclipse - A Data Geek's ViewOn Sunday, May 20, 2012, an annular eclipse was visible in large parts of the United States, including here in Pasadena. To the data geeks here at Run on Sun, that gave us a view to the eclipse that was just a bit different - a Data Geek's view, if you will. One of the great things about having a solar power system that is monitored - particularly with a system like Enlighten from Enphase - is that it automatically captures a great deal of data and sometimes that data can be used to look at some surprising things - like a solar eclipse! So this will be a brief tutorial on how to take a raw data set and turn that into a graphical representation of the solar eclipse. (We used Excel 2010 for our analysis, but any tool that allows for the creation of pivot tables should allow you to do the same thing.) HypothesisWe started out with a simple hypothesis - since the annular eclipse covered as much as 80% of the sun's surface (as seen from SoCal), we would anticipate that there would be a significant impact on the output of a solar power system during the eclipse. If we looked at the data from the days prior to the eclipse (excluding any days that were dominated by cloud cover during the relevant time when the eclipse occurred) we should see a noticeable decline in system output relative to the other days. If we graphed those days on the same graph, the eclipse should be an obvious outlier. But to test our hypothesis, we would need to gather some data! To see how we went from this real world event... 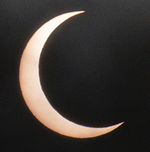
To this, our "data geek" view… 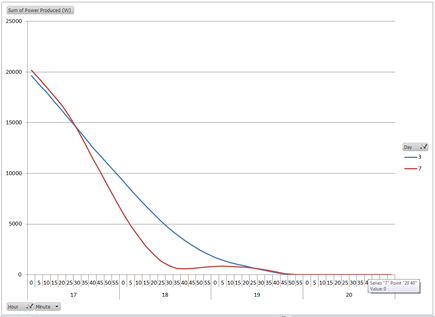
Read Solar Eclipse - A Data Geek's View on our blog. |