Category: "SCE"
02/09/23
Categories: All About Solar Power, SCE, Commercial Solar, Residential Solar, Ranting, Non-profit solar, Net Metering
With Response Times Increasing, SCE Unilaterally Doubles Processing Times - Where's the CPUC???
Some people are simply shameless, and it appears that the powers-that-be at SCE are among them. We just got this charming missive from the division at SCE that is responsible for processing Interconnection Applications:
Subject: Extended NEM Application Processing Timelines
Hello Contractors and Installers,
We are currently experiencing a high volume of new NEM applications. As a result, processing timelines are taking longer than expected. Please note, Interconnection Requests (IRs) may exceed our average processing timelines. Although most applications will be reviewed within 10 business days, some may take up to 20 business days to review.
To help mitigate this volume, we strongly recommend that you submit your application and the required documents in complete form, including all signatures and attachments. Ensuring that your applications are submitted in complete form helps us to minimize the number of touchpoints and reduce the application queue.
We request your cooperation and understanding as we work diligently in decreasing the application volume. Please refer to PowerClerk for the latest status of your application. If you have any additional questions, please send an email to Customer.Generation@sce.com.
Sincerely,
Eduyng Castano
Senior Manager of Customer Generation Programs
Southern California Edison
To deem this outrageous is to be way too kind. Gee, I wonder why there is a high volume of applications? Could it be because the bottom is dropping out of solar economics in SCE territory after the April 14th deadline? Who could have predicted that - apart from pretty much everyone who is paying attention. And how is it that SCE can unilaterally change the requirement for them to process applications? Doesn’t the CPUC have something to say about this?
The existing standard of 10 business days - two weeks on the calendar - was already a joke, but now they are saying that “some” applications could take 20 business days - nearly a month! Oh and to add insult to injury, they also raised the application fee - you know, the money that is supposed to cover application processing - by 25%! Must be nice to be able to jack the price that you are charging, while simultaneously reducing the service provided. Aren’t monopolies swell?
This is getting real folks. In an earlier post - find it here - we stated that we couldn’t guarantee NEM 2.0 for applications submitted after March 31st. But given this revision - and zero clarity on which applications might hit that 20-day limit, we need to push things up. RUN ON SUN WILL NOT GUARANTEE NEM 2.0 FOR ANY APPLICATION SUBMITTED AFTER MARCH 15! (The Ides of March indeed!)
This is a terrible way to run a business, but we have no control over the arbitrary nonsense coming from SCE. Please plan accordingly!
10/22/21
Categories: SCE, Residential Solar, Net Metering
Battle to Save Rooftop Solar - Act Now!
Readers of this blog are well aware of the fight being waged before the California Public Utilities Commission (CPUC) as we first wrote about this back in February! Now we are entering the final stretch in this fight, and quite frankly, we are losing.
Why, you ask? How can we be losing the battle to preserve your right to put solar on your home or business, when everybody loves that idea? The answer is easy: the opposing forces - we are talking about you here, Southern California Edison - have nearly infinitely more money than we do, and they are spending it like crazy. So how do we possibly fight back?
With you. And tens of thousands of other folks just like you.
The California Solar and Storage Association (CALSSA) - our trade association - is fighting hard to preserve the value of the investment made by past solar clients, and those in the future. They have created an audacious goal: generate 200,000 public comments by November 20! Here’s how CALSSA framed the fight:
“If the broad light of day could be let in upon men’s actions, it would purify them as the sun disinfects” – 1891, Louis Brandeis, US Supreme Court Justice
In 2015, the pro-solar coalition submitted 130,000 public comments to the CPUC on the NEM-2 decision. Today, as we near the homestretch in the NEM-3 proceeding, the headwinds are greater and the opposition better organized. Therefore, we are launching a campaign today to reach our goal of generating two hundred thousand public comments by November 20. Reaching this goal would break the record for the greatest number of public comments received by a state agency in history – previously set by solar advocates in 2015. Simply put, two hundred thousand is a number that the CPUC and the governor simply can’t ignore. It is the sunshine that is needed to fight against the corrupting influence of SCE and the other utilities.
We cannot afford anyone sitting on the sidelines. If you own a solar power system, the value of your investment is at stake. If you realize that rooftop solar is a key piece in how we reduce carbon emissions to combat climate change, that goal is under attack!
It’s easy to join the fight: Mash that button below and tell the CPUC to side with solar consumers and not with the utilities!
03/14/21
SCE Just Hiked Their Rates - Here's What That Means For You!
While you weren’t watching, SCE - the same SCE that is trying to kill off rooftop solar - just raised their Time-of-Use rates for residential customers. We will break down the increase and show you what it might mean for a couple of potential solar clients.
What are Time-of-Use Rates?
Time-of-Use (or TOU) rates are exactly what they sound like: a rate structure where how much you pay for energy is tied to when you use that energy. (We wrote a lengthy blog post explaining the differences between TOU rates and Tiered rates, in gory detail!)
The most common TOU rate for SCE’s residential customers is titled TOU-D, with the 4-9 p.m. window having the highest rates overall. Compared to a tiered rate - where your monthly bill is divided into steps based on the volume of energy that you use, with each volumetric step, or tier, bringing you a higher rate - a TOU rate does not increase on volume but on the time of day. As a result, rates during peak periods can be 50% or more higher than the lowest periods. Of course, that peak period - either 4-9 or 5-8 with SCE - corresponds to when people generally use the most energy! Gotcha!!! (Those rate differentials are what provide the economic benefit of adding storage, and make simple strategies - like delaying the dishwasher or EV charging until out of peak rates - effective at saving money.)
How is SCE’s TOU Rate Changing?
Needless to say, SCE’s rates are very complex, with the energy charge being comprised of some eleven different components! I will spare you those distressing details and just focus on the overall energy charge and how it has changed, as shown in this table:
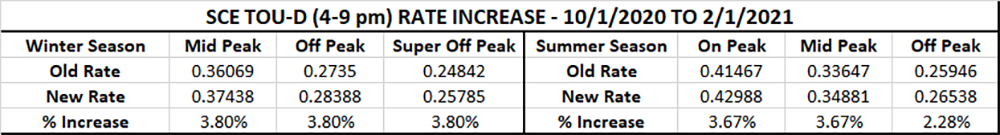
SCE’s TOU-D Rate change for the 4-9 p.m. option.
On average, we see that rates here have increased between 3.67 and 3.80% over the prior rate, but there are some special gifts to solar customers buried in the rates. When the Net Metering rules were changed a few years ago, it introduced the concept of Non-Bypassable Charges (or NBCs) - components of the rate structure that solar customers paid for every killowatt hour pulled from the grid, even if that same kWh was netted back by energy exported to the grid. Far and away the largest NBC is the Public Purpose Programs charge, and in this rate increase it jumped from 1.323¢/kWh to 1.622¢/kWh - a whopping 22.6% increase!
Another fun fact for SCE customers who have endured so called public-safety shutdowns, is that they are paying 0.6¢/kWh toward the “wildfire fund charge"! That’s right, SCE’s customers are helping to pay for an insurance fund against wildfires caused by SCE, PG&E, and SDG&E - now isn’t that almost enough to get one hot enough to, well, burn!
Use Case Impacts
We decided to examine how potential clients would see their bills, and potential savings, change under the new rate structure. As always, we made use of the wonderful tool Energy Toolbase to do our calculations.
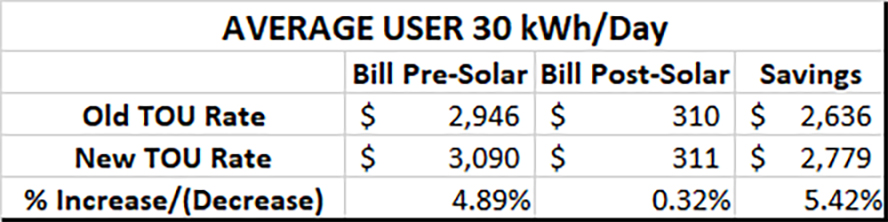 Our first example is a pretty average user in the Run on Sun service area, consuming approximately 30 kWh of energy per day, pre-solar. Under the old TOU rate their annual bill pre-solar was $2,946, but under the new rate (including things like utility user taxes, etc.) their bill would go up by nearly 5%, an extra $144 for the year. However, their post-solar savings also increase, by 5.42% or an extra $143 per year. For this average user, adding solar ended up being a nearly perfect hedge against the SCE rate increase!
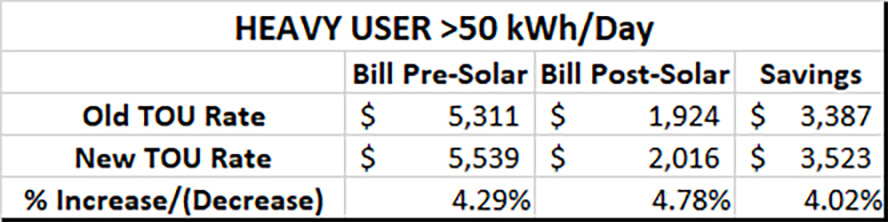 Our second user does not fare quite as well. This is a significantly larger user, consuming more than 50 kWh/day. Their pre-solar bill increases by 4.29%, or $228. Unfortunately, while their overall savings increases, it is not as dramatic as it is for the smaller user, reducing the differential from $228 to $92, compared to reducing it to just $1 for the average user.
Bottom line - adding solar helps hedge against rate increases, and as energy costs get higher, your annual savings will increase!
Meanwhile, SCE is Trying to Kill Rooftop Solar
It is one thing for SCE to be seeking, and getting, rate increases from the CPUC - that is their business model. It is quite another thing for them to try and gut the value of net metering, thereby eliminating the economic value of adding solar - but that is precisely what they are trying to do! We are fighting back, starting with a signature campaign targeted at a petition to Governor Newsom.
There will be lots more to do in the coming days to fight against SCE’s attack on solar, but for now there is something simple that you can do - mash that button below and go sign the petition!
04/10/18
Categories: All About Solar Power, Solar Economics, PWP, SCE, Energy Efficiency, Residential Solar
My Electric Bill is So High! Will Solar Help? Part 1: How High is High?
We hear it all the time: “My electric bill is so high, I just want to stick it to [insert name of utility here]! Can solar help?” Now we are in the business of selling and installing solar, so our preferred answer is, “Of Course!" But that is not always the answer we end up giving. So Part 1 of this three-part series focuses on that electric bill to answer a few questions first: 1) How high is it? 2) What can you do to make it lower - pre-solar? And 3) Is your home even a good candidate for going solar? Let’s look at each in turn…
How High is High?
Ask most any consumer how high their electric bill is and they will all pretty much tell you – too high! So let’s recognize a few things at the start: if you are a PWP or DWP customer, your electric bills will be lower than your compatriots sufferi, er, living, in SCE territory. SCE bills monthly, whereas PWP and DWP bill (roughly) every two months. Most non-solar, residential customers are on a tiered rate structure - that is, the more you use, the more you pay for what you are using. That said, not all tiered rates are alike: SCE has a true, three-tier rate structure where the cost increases in each subsequent tier, whereas PWP has a bizarre structure where the “highest” tier is actually cheaper than the middle tier! (I wonder how many PWP customers realize that perverse incentive?)
Taken together, what can you say about how high is high? We would break it down roughly this way:
- $100 per month or less - Solar is probably not going to pencil out for you. While there are many reasons to go solar besides the economic ones, if your bill is this low, saving money is not going to justify solar.
- $100 to $300 per month – depending on the other factors discussed below, bills in this range are more likely to have a strong economic justification, particularly in DWP territory, where a small rebate remains to help lower your out-of-pocket cost.
- $300 or more per month – Solar is exactly what you need! The higher your bill, the more solar makes sense. (We had a client with bills that averaged over $1,000 per month! His payback was four and a half years!)
To illustrate how and why that works, let’s look at the modeling that goes into sizing your system. (For this analysis we made use of Energy Toolbase, one of the most sophisticated tools available for modeling the performance of PV systems and producing comprehensive, authoritative and transparent solar proposals.) We created three different usage profiles corresponding to the categories set forth above. All were SCE customers under the current Domestic rate structure in region 9 (i.e., Altadena). The first had usage such that their average bill was under $100/month. The second had bills between $200 and $300/month, and the third had bill in excess of $450/month. In each case, summer usage was higher than the rest of the year.

Energy Toolbase allows an installer to run multiple simulations of total bill savings based on the size of the system to be installed. On the right is that output for our middle-case client. It’s a little hard to see in the small version of the graph (click on it for larger), but the light green line (which represents the savings under the new, SCE-forced rate structure) levels off at 7.9 kW. That inflection point means that a system sized larger than that is no longer providing a full economic benefit to the client.
We performed similar analyses for the other two use cases to determine the optimal system size, and to then determine their savings and payback. Here are our results:
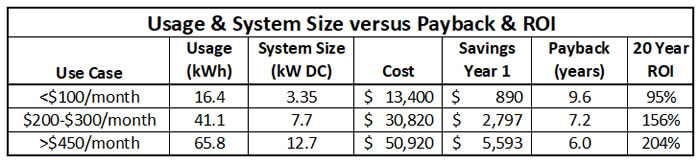
As system size increases, even without assuming any improvement in price based on economy of scale (the system price in each case is $4.00/Watt), it is clear that larger systems have significantly greater return on investment over the life of the system. If your bills fall into that third use case, you are going to benefit greatly by adding solar. But in that first use case, not so much.
What can you do to make your bills lower – before adding solar?
However, even if your use case makes sense, it is important to consider some low-hanging fruit before plunking down thousands of dollars on a solar power system. The two most obvious candidates for investment are pool pumps and air conditioning systems.
Pool Pumps
Older pool pumps tend to have single speed motors, which means that they draw the same amount of energy all the time. But harken back to your elementary school science classes: a body at rest tends to stay at rest; a body in motion tends to stay in motion. (Thank you, Isaac Newton!) What’s that got to do with pool pumps? Well, all that water in your pool has a lot of mass and when it is just sitting there it takes a great deal of energy to get it moving - it’s a big body at rest! But once you get it moving, it is relatively easy to keep it moving, so you need to expend a lot less energy to do so.
Single-speed pool pump motors don’t get that, and they just keep pumping as hard as they can the entire time they are on. That is wasteful, and expensive. A variable-speed pump, on the other hand, embraces the eternal wisdom of Sir Newton, and throttles down over time. That saves energy, and thus money. Even better, utilities like SCE will give you a rebate (from SCE that is $200!) toward the cost of installing a variable-speed pool pump.
Updated A/C
The other big opportunity for savings is in an updated A/C system. Newer systems are significantly more efficient out-of-the-box, and as older systems age, their efficiency decreases, meaning they are costing you more to operate.
Other Savings Opportunities
You don’t really have an old refrigerator running in your garage, do you? If it is old, it is inefficient, and you’ve just put it in the hottest part of your home (short of the attic) so it has to work really hard to keep that case of beer cold. Either ditch it altogether, or only run it when that party is about to happen!
How old is your thermostat? Does it even work, or do you just use it as an on/off switch? New, smart thermostats can save you money - and there is likely a rebate there, too!
How good a candidate is your home for solar?
Ok, your use case is compelling, even after harvesting all that luscious, low-hanging fruit. So is it now certain that solar will help? Um, maybe. How good of a candidate is your home for solar?
We have written about this at length before, for example here and here. If you have lots of shading, your house will not be a good candidate – you don’t want to be the owner of a system installed under a tree!
But other issues can change the value proposition for installing solar. For example, your electrical service might be ancient and undersized, requiring you to spend additional money to upgrade to a newer, larger service. If you are installing a relatively large PV system, that is a relatively small increase, but on our small use case, upgrading your service panel can add 10 to 15% to the total cost.
Other factors that are not show-stoppers but which increase costs are second-story and/or steeply pitched roofs (both of which just make the labor costs higher because the work goes slower), roofs other than composition shingles, service panels located far from where the array needs to go (like the array on a detached garage but the service panel in on the side of the house with a concrete driveway in between).
How can you know for sure? Simple, have a professional installer come out and do a proper site evaluation. So how do you find such a person? Ah, that is the subject of Part 2: How Do I Find Someone to Trust?
10/28/16
Categories: All About Solar Power, PWP, SCE, Residential Solar, Ranting
Understanding Tiered vs TOU Rates
A client of ours noted that Pasadena Water and Power (PWP) offers, in addition to its regular, Residential tiered rate structure, the option to switch to a Time-of-Use rate structure, and he asked if he would derive additional savings from making that switch. Turns out that is not an easy question to answer, and there certainly isn’t a “one size fits all” result. We decided to take a closer look into these rates both for PWP and for the folks in Southern California Edison (SCE) territory.
SPOILER ALERT - The following is pretty much down in the weeds. You have been warned!
Defining Tiered and Time-of-Use (TOU) Rates
Let’s start by defining our terms. Most residential electric customers, of both PWP and SCE, are on a tiered rate structure. That means that there are two or more cost steps - called tiers - for the energy that you use. Tiered rates assume that there is some minimally expensive charge for the first allocation of energy per billing cycle, and that as you use more energy your cost for energy increases. For example, SCE’s Domestic rate has three tiers and in the first tier the charge is 8.8¢/kWh, in the second tier the charge is 16¢/kWh, but the final tier is 22.4¢/kWh! (There is also a non-tiered component that adds another 6.9¢/kWh to the customer’s bill.)
PWP, on the other hand, has a somewhat perverse tier structure in that the lowest tier is very cheap, 1.7¢/kWh, the second tier is significantly higher, 13.5¢/kWh, but the final tier actually goes down to just 9.9¢/kWh! Since the whole point of tiered rates is to provide an incentive for heavy users to reduce their usage, PWP is actually rewarding those who consume more than 25 kWh per day with lower rates! Very odd.
Time-of-use rates, on the other hand, are generally not tiered. Instead, the day is broken up into segments and the cost of energy varies depending on the segment in which it is consumed. PWP refers to these segments as “On-Peak” (from 3-8 p.m.) and “Off-Peak” (all other hours). But PWP’s TOU rate retains the tiered element as well, making it a truly odd hybrid rate structure.
SCE’s approach is more involved, dividing the day into three, more complicated segments: “On-Peak” (2-8 p.m. weekdays - holidays excluded), “Super Off-Peak” (10 p.m. to 8 a.m. everyday), and “Off-Peak” (all other hours).
For both PWP and SCE there is a seasonal overlay on these rates, with energy costs increasing in the summer months (defined as June 1 through September 30).
(It is important to note that both PWP’s and SCE’s TOU rates put the most expensive energy in the late afternoon to evening time period - pricing energy to offset against the “head of the duck.” Ultimately, these rates will create the energy storage market in California, but that is a post for another day.
Analyzing the Benefits of a Rate Switch - Pre-Solar
Assuming that one can create a spreadsheet to model these different rates (not a small task in and of itself!) there is one more hangup - data. Both PWP and SCE report total monthly usage to customers on their tiered rate plans - but in order to analyze your potential bill under a TOU rate, you must have hourly usage data for every day of the year! (Because there are 8,760 hours in a [non-leap] year, such a usage data collection is typically referred to as an 8760 file.)
The standard meters that PWP has installed simply do not record that data, so the average PWP customer has no way to know whether they would save money by making the switch.
On the other hand, most SCE customers do have access to that data and they can download it from SCE’s website.
After you create an account, login to it and go the “My Account” page. On the left-hand-side you will see some options - click on “My Green Button Data” (the too cute by half name for the interval data you are seeking), select the data range for the past twelve months, set the download format to “csv” and check the account from which to download. Then press the “download” button and cross your fingers - in our experience, the SCE website fails about as often as it actually produces the data that you are seeking!
Modeling PWP
Given that PWP doesn’t have data available, is there any way to estimate what the results might be? The answer is, sort of. We took an 8760 data set from an SCE customer and used that as our test data for both PWP and SCE. (The data file does not identify the customer.) Since the data file has an entry for every hour of every day, we can segment the usage against the On-Peak and Off-Peak hours, and using a pivot table - probably the most powerful took in Excel - we can summarize those values over the course of the year, as you see in Figure 1.
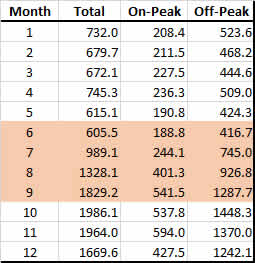
Figure 1 - Usage Profile for PWP
Summer months are highlighted in orange. For this specific energy usage profile, Off-Peak usage is more than twice that of the On-Peak usage (9,806 to 4,009 kWh respectively). So how does that work out when we apply the two different rate structures? The table in Figure 2 shows the details of the two rates:
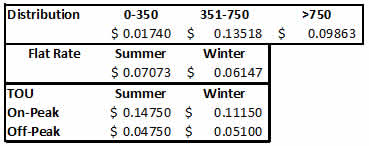
Figure 2 - PWP Rates - Standard Residential and TOU
Under both rate plans, the distribution is tiered (with the perverse reverse incentive for usage above 750 kWh). Added to that is either the seasonally adjusted flat rate for energy, or the seasonally adjusted TOU energy charge.
Applying those rates to the Usage Profile in Figure 1 allows us to see what the energy and distribution components would be under both approaches. Given the hybrid nature of these rates, you might expect them to be similar and you would be correct. The distribution charge - which applies to both - comes to $1,180 for the year. The flat rate energy charge comes to $893, whereas the TOU charge is $985. Meaning that someone electing to use the TOU rate would have a yearly total of $2,165, whereas the flat rate user would have a total bill of $2,074, making the TOU rate - for this specific energy profile - 4% higher.
Beyond that, PWP has a number of other charges - such as a public benefit charge, an underground surtax, and a transmission charge - that are only tied to total usage, so the ultimate difference between these two rates is even smaller.
Modeling SCE
SCE rate structures are significantly more complicated that PWP’s. For example, the tier 1 (aka baseline) allocation varies by location. Since SCE covers such a huge and diverse area from cool coastal regions to absolute deserts, customers are allocated more energy per day in their baseline depending upon where they live. In the area around Pasadena that is covered by SCE, a typical daily baseline allowance would be 13.3 kWh in the summer and 10.8 kWh in the non-summer months. The baseline then is that number times the number of days in the billing cycle. Tier 2 applies to every kWh above baseline, but below 200% of baseline. Tier 3 applies to everything beyond that. As with PWP, the tiered rate only applies to “delivery” charges. The energy generation charges are the same all year. Here’s what that rate structure looks like:
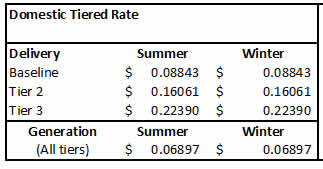
Figure 3 - SCE’s Tiered Domestic Rate
The first thing that you notice when you look at this rate is how much higher it is than the rates from PWP, and the end calculation bears that out - the same usage that resulted in an annual bill of $2,074 in Pasadena becomes $3,227 once you cross the border into Altadena, South Pasadena, San Marino, or Sierra Madre - an increase of 56%! (There’s a reason why a growing percentage of our clients are coming from those surrounding, SCE-territory communities!)
So what would happen if this beleaguered client were to shift to a TOU rate? First, we need to re-parse the usage data according to SCE’s more complicated segmentation scheme, which gives us Figure 4:
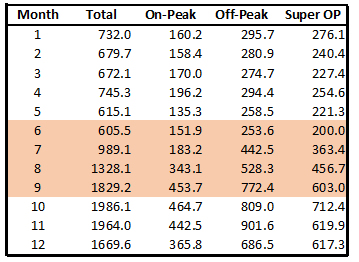
Figure 4 - SCE’s Segmented Usage Data
Once again, the On-Peak usage is the smallest category of the three, amounting to just 23% of total usage, compared to 42% in Off-Peak, and 35% in Super Off-Peak.
Of course, SCE can’t do anything in a simple fashion, so they have not one but two basic approaches to their TOU rates, Option A and Option B. Option A rates run from a low of 13¢/kWh (in summer Super Off-Peak), to 29¢/kWh (during summer Off-Peak) to an eye-popping 44¢/kWh (during summer On-Peak). However, Option A includes a credit of 9.9¢/kWh on the first baseline worth of energy which reduces the monthly bill by roughly $30.
Option B deletes that baseline credit and replaces it with a “meter charge” (even though it is the same meter!) of 53.8¢/kWh/day, or roughly $17/month. In return, the On-Peak charges are significantly reduced from 44¢/kWh to just 32¢/kWh.
So how does this shake out? The results are quite surprising, as shown in Figure 5.
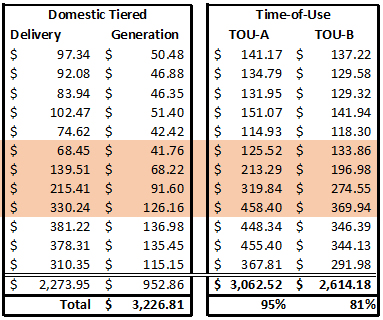
Figure 5 - SCE Rate Structure Comparison
The two left columns show the month-by-month calculations for both delivery (the tiered component) and generation (the flat component). The two right columns show the month-by-month calculations for the two different TOU rates.
The bottom line is striking: under TOU-A there is a savings of 5% over the tiered rate, whereas the savings jump to 19% by going to TOU-B! That is a savings of $600/year just by changing rate plans - a switch that any SCE customer can make.
MAJOR CAVEAT: YOUR MILEAGE WILL VARY!
The results displayed here are entirely dependent on your actual energy usage and no two usage profiles are alike. It is possible, even likely, that some usage profiles will see an increase in bills under either TOU option.
The good news is, that for a nominal fee, this is an analysis that we could do for any SCE residential customer - we would just need access to your usage data.
So that completes our pre-solar analysis. In our next post, we will look at how these results change when you add a solar power system into the mix.