Category: "PWP"
04/10/18
Categories: All About Solar Power, Solar Economics, PWP, SCE, Energy Efficiency, Residential Solar
My Electric Bill is So High! Will Solar Help? Part 1: How High is High?
We hear it all the time: “My electric bill is so high, I just want to stick it to [insert name of utility here]! Can solar help?” Now we are in the business of selling and installing solar, so our preferred answer is, “Of Course!" But that is not always the answer we end up giving. So Part 1 of this three-part series focuses on that electric bill to answer a few questions first: 1) How high is it? 2) What can you do to make it lower - pre-solar? And 3) Is your home even a good candidate for going solar? Let’s look at each in turn…
How High is High?
Ask most any consumer how high their electric bill is and they will all pretty much tell you – too high! So let’s recognize a few things at the start: if you are a PWP or DWP customer, your electric bills will be lower than your compatriots sufferi, er, living, in SCE territory. SCE bills monthly, whereas PWP and DWP bill (roughly) every two months. Most non-solar, residential customers are on a tiered rate structure - that is, the more you use, the more you pay for what you are using. That said, not all tiered rates are alike: SCE has a true, three-tier rate structure where the cost increases in each subsequent tier, whereas PWP has a bizarre structure where the “highest” tier is actually cheaper than the middle tier! (I wonder how many PWP customers realize that perverse incentive?)
Taken together, what can you say about how high is high? We would break it down roughly this way:
- $100 per month or less - Solar is probably not going to pencil out for you. While there are many reasons to go solar besides the economic ones, if your bill is this low, saving money is not going to justify solar.
- $100 to $300 per month – depending on the other factors discussed below, bills in this range are more likely to have a strong economic justification, particularly in DWP territory, where a small rebate remains to help lower your out-of-pocket cost.
- $300 or more per month – Solar is exactly what you need! The higher your bill, the more solar makes sense. (We had a client with bills that averaged over $1,000 per month! His payback was four and a half years!)
To illustrate how and why that works, let’s look at the modeling that goes into sizing your system. (For this analysis we made use of Energy Toolbase, one of the most sophisticated tools available for modeling the performance of PV systems and producing comprehensive, authoritative and transparent solar proposals.) We created three different usage profiles corresponding to the categories set forth above. All were SCE customers under the current Domestic rate structure in region 9 (i.e., Altadena). The first had usage such that their average bill was under $100/month. The second had bills between $200 and $300/month, and the third had bill in excess of $450/month. In each case, summer usage was higher than the rest of the year.

Energy Toolbase allows an installer to run multiple simulations of total bill savings based on the size of the system to be installed. On the right is that output for our middle-case client. It’s a little hard to see in the small version of the graph (click on it for larger), but the light green line (which represents the savings under the new, SCE-forced rate structure) levels off at 7.9 kW. That inflection point means that a system sized larger than that is no longer providing a full economic benefit to the client.
We performed similar analyses for the other two use cases to determine the optimal system size, and to then determine their savings and payback. Here are our results:
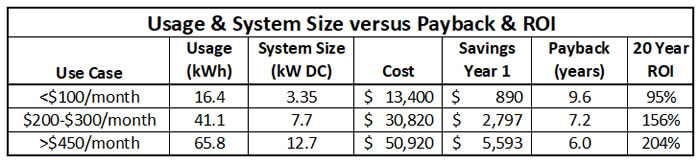
As system size increases, even without assuming any improvement in price based on economy of scale (the system price in each case is $4.00/Watt), it is clear that larger systems have significantly greater return on investment over the life of the system. If your bills fall into that third use case, you are going to benefit greatly by adding solar. But in that first use case, not so much.
What can you do to make your bills lower – before adding solar?
However, even if your use case makes sense, it is important to consider some low-hanging fruit before plunking down thousands of dollars on a solar power system. The two most obvious candidates for investment are pool pumps and air conditioning systems.
Pool Pumps
Older pool pumps tend to have single speed motors, which means that they draw the same amount of energy all the time. But harken back to your elementary school science classes: a body at rest tends to stay at rest; a body in motion tends to stay in motion. (Thank you, Isaac Newton!) What’s that got to do with pool pumps? Well, all that water in your pool has a lot of mass and when it is just sitting there it takes a great deal of energy to get it moving - it’s a big body at rest! But once you get it moving, it is relatively easy to keep it moving, so you need to expend a lot less energy to do so.
Single-speed pool pump motors don’t get that, and they just keep pumping as hard as they can the entire time they are on. That is wasteful, and expensive. A variable-speed pump, on the other hand, embraces the eternal wisdom of Sir Newton, and throttles down over time. That saves energy, and thus money. Even better, utilities like SCE will give you a rebate (from SCE that is $200!) toward the cost of installing a variable-speed pool pump.
Updated A/C
The other big opportunity for savings is in an updated A/C system. Newer systems are significantly more efficient out-of-the-box, and as older systems age, their efficiency decreases, meaning they are costing you more to operate.
Other Savings Opportunities
You don’t really have an old refrigerator running in your garage, do you? If it is old, it is inefficient, and you’ve just put it in the hottest part of your home (short of the attic) so it has to work really hard to keep that case of beer cold. Either ditch it altogether, or only run it when that party is about to happen!
How old is your thermostat? Does it even work, or do you just use it as an on/off switch? New, smart thermostats can save you money - and there is likely a rebate there, too!
How good a candidate is your home for solar?
Ok, your use case is compelling, even after harvesting all that luscious, low-hanging fruit. So is it now certain that solar will help? Um, maybe. How good of a candidate is your home for solar?
We have written about this at length before, for example here and here. If you have lots of shading, your house will not be a good candidate – you don’t want to be the owner of a system installed under a tree!
But other issues can change the value proposition for installing solar. For example, your electrical service might be ancient and undersized, requiring you to spend additional money to upgrade to a newer, larger service. If you are installing a relatively large PV system, that is a relatively small increase, but on our small use case, upgrading your service panel can add 10 to 15% to the total cost.
Other factors that are not show-stoppers but which increase costs are second-story and/or steeply pitched roofs (both of which just make the labor costs higher because the work goes slower), roofs other than composition shingles, service panels located far from where the array needs to go (like the array on a detached garage but the service panel in on the side of the house with a concrete driveway in between).
How can you know for sure? Simple, have a professional installer come out and do a proper site evaluation. So how do you find such a person? Ah, that is the subject of Part 2: How Do I Find Someone to Trust?
05/20/17
Categories: All About Solar Power, PWP Rebates, PWP, Ranting
Run on Sun is Pasadena Solar!
Run on Sun has been doing Pasadena Solar for more than 10 years, but only now have we gotten around to dedicating a webpage just to Pasadena Solar!
 Who loves Pasadena Solar?

I know, kinda silly (and foolish from an SEO perspective) but we figured we were fine as we were. But then I looked at the search results on Google for “Pasadena Solar” and it was really depressing. I mean seriously - read some of those reviews and you know that they are fake - but still their related websites were getting better rankings than ours! Not acceptable!!!
So now, if you want to see a webpage that proudly proclaims its love for Pasadena Solar, we’ve got you covered - complete with this iconic image!
Oh, and because we do so much work in neighboring Altadena we are hoping to do a shout-out page for them too but we need an idea for the quintessential Altadena image - if you have ideas, please let us know!
10/28/16
Categories: All About Solar Power, PWP, SCE, Residential Solar, Ranting
Understanding Tiered vs TOU Rates
A client of ours noted that Pasadena Water and Power (PWP) offers, in addition to its regular, Residential tiered rate structure, the option to switch to a Time-of-Use rate structure, and he asked if he would derive additional savings from making that switch. Turns out that is not an easy question to answer, and there certainly isn’t a “one size fits all” result. We decided to take a closer look into these rates both for PWP and for the folks in Southern California Edison (SCE) territory.
SPOILER ALERT - The following is pretty much down in the weeds. You have been warned!
Defining Tiered and Time-of-Use (TOU) Rates
Let’s start by defining our terms. Most residential electric customers, of both PWP and SCE, are on a tiered rate structure. That means that there are two or more cost steps - called tiers - for the energy that you use. Tiered rates assume that there is some minimally expensive charge for the first allocation of energy per billing cycle, and that as you use more energy your cost for energy increases. For example, SCE’s Domestic rate has three tiers and in the first tier the charge is 8.8¢/kWh, in the second tier the charge is 16¢/kWh, but the final tier is 22.4¢/kWh! (There is also a non-tiered component that adds another 6.9¢/kWh to the customer’s bill.)
PWP, on the other hand, has a somewhat perverse tier structure in that the lowest tier is very cheap, 1.7¢/kWh, the second tier is significantly higher, 13.5¢/kWh, but the final tier actually goes down to just 9.9¢/kWh! Since the whole point of tiered rates is to provide an incentive for heavy users to reduce their usage, PWP is actually rewarding those who consume more than 25 kWh per day with lower rates! Very odd.
Time-of-use rates, on the other hand, are generally not tiered. Instead, the day is broken up into segments and the cost of energy varies depending on the segment in which it is consumed. PWP refers to these segments as “On-Peak” (from 3-8 p.m.) and “Off-Peak” (all other hours). But PWP’s TOU rate retains the tiered element as well, making it a truly odd hybrid rate structure.
SCE’s approach is more involved, dividing the day into three, more complicated segments: “On-Peak” (2-8 p.m. weekdays - holidays excluded), “Super Off-Peak” (10 p.m. to 8 a.m. everyday), and “Off-Peak” (all other hours).
For both PWP and SCE there is a seasonal overlay on these rates, with energy costs increasing in the summer months (defined as June 1 through September 30).
(It is important to note that both PWP’s and SCE’s TOU rates put the most expensive energy in the late afternoon to evening time period - pricing energy to offset against the “head of the duck.” Ultimately, these rates will create the energy storage market in California, but that is a post for another day.
Analyzing the Benefits of a Rate Switch - Pre-Solar
Assuming that one can create a spreadsheet to model these different rates (not a small task in and of itself!) there is one more hangup - data. Both PWP and SCE report total monthly usage to customers on their tiered rate plans - but in order to analyze your potential bill under a TOU rate, you must have hourly usage data for every day of the year! (Because there are 8,760 hours in a [non-leap] year, such a usage data collection is typically referred to as an 8760 file.)
The standard meters that PWP has installed simply do not record that data, so the average PWP customer has no way to know whether they would save money by making the switch.
On the other hand, most SCE customers do have access to that data and they can download it from SCE’s website.
After you create an account, login to it and go the “My Account” page. On the left-hand-side you will see some options - click on “My Green Button Data” (the too cute by half name for the interval data you are seeking), select the data range for the past twelve months, set the download format to “csv” and check the account from which to download. Then press the “download” button and cross your fingers - in our experience, the SCE website fails about as often as it actually produces the data that you are seeking!
Modeling PWP
Given that PWP doesn’t have data available, is there any way to estimate what the results might be? The answer is, sort of. We took an 8760 data set from an SCE customer and used that as our test data for both PWP and SCE. (The data file does not identify the customer.) Since the data file has an entry for every hour of every day, we can segment the usage against the On-Peak and Off-Peak hours, and using a pivot table - probably the most powerful took in Excel - we can summarize those values over the course of the year, as you see in Figure 1.
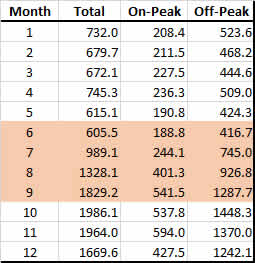
Figure 1 - Usage Profile for PWP
Summer months are highlighted in orange. For this specific energy usage profile, Off-Peak usage is more than twice that of the On-Peak usage (9,806 to 4,009 kWh respectively). So how does that work out when we apply the two different rate structures? The table in Figure 2 shows the details of the two rates:
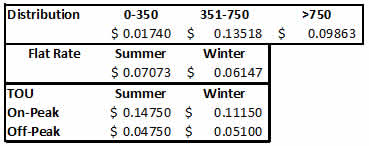
Figure 2 - PWP Rates - Standard Residential and TOU
Under both rate plans, the distribution is tiered (with the perverse reverse incentive for usage above 750 kWh). Added to that is either the seasonally adjusted flat rate for energy, or the seasonally adjusted TOU energy charge.
Applying those rates to the Usage Profile in Figure 1 allows us to see what the energy and distribution components would be under both approaches. Given the hybrid nature of these rates, you might expect them to be similar and you would be correct. The distribution charge - which applies to both - comes to $1,180 for the year. The flat rate energy charge comes to $893, whereas the TOU charge is $985. Meaning that someone electing to use the TOU rate would have a yearly total of $2,165, whereas the flat rate user would have a total bill of $2,074, making the TOU rate - for this specific energy profile - 4% higher.
Beyond that, PWP has a number of other charges - such as a public benefit charge, an underground surtax, and a transmission charge - that are only tied to total usage, so the ultimate difference between these two rates is even smaller.
Modeling SCE
SCE rate structures are significantly more complicated that PWP’s. For example, the tier 1 (aka baseline) allocation varies by location. Since SCE covers such a huge and diverse area from cool coastal regions to absolute deserts, customers are allocated more energy per day in their baseline depending upon where they live. In the area around Pasadena that is covered by SCE, a typical daily baseline allowance would be 13.3 kWh in the summer and 10.8 kWh in the non-summer months. The baseline then is that number times the number of days in the billing cycle. Tier 2 applies to every kWh above baseline, but below 200% of baseline. Tier 3 applies to everything beyond that. As with PWP, the tiered rate only applies to “delivery” charges. The energy generation charges are the same all year. Here’s what that rate structure looks like:
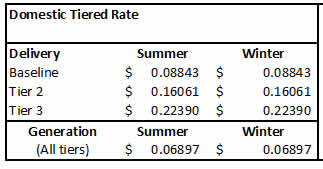
Figure 3 - SCE’s Tiered Domestic Rate
The first thing that you notice when you look at this rate is how much higher it is than the rates from PWP, and the end calculation bears that out - the same usage that resulted in an annual bill of $2,074 in Pasadena becomes $3,227 once you cross the border into Altadena, South Pasadena, San Marino, or Sierra Madre - an increase of 56%! (There’s a reason why a growing percentage of our clients are coming from those surrounding, SCE-territory communities!)
So what would happen if this beleaguered client were to shift to a TOU rate? First, we need to re-parse the usage data according to SCE’s more complicated segmentation scheme, which gives us Figure 4:
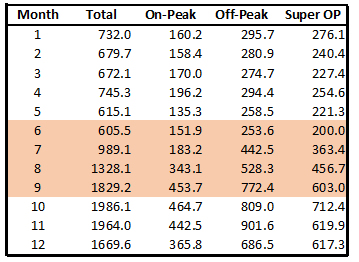
Figure 4 - SCE’s Segmented Usage Data
Once again, the On-Peak usage is the smallest category of the three, amounting to just 23% of total usage, compared to 42% in Off-Peak, and 35% in Super Off-Peak.
Of course, SCE can’t do anything in a simple fashion, so they have not one but two basic approaches to their TOU rates, Option A and Option B. Option A rates run from a low of 13¢/kWh (in summer Super Off-Peak), to 29¢/kWh (during summer Off-Peak) to an eye-popping 44¢/kWh (during summer On-Peak). However, Option A includes a credit of 9.9¢/kWh on the first baseline worth of energy which reduces the monthly bill by roughly $30.
Option B deletes that baseline credit and replaces it with a “meter charge” (even though it is the same meter!) of 53.8¢/kWh/day, or roughly $17/month. In return, the On-Peak charges are significantly reduced from 44¢/kWh to just 32¢/kWh.
So how does this shake out? The results are quite surprising, as shown in Figure 5.
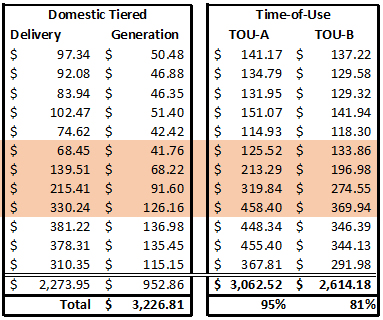
Figure 5 - SCE Rate Structure Comparison
The two left columns show the month-by-month calculations for both delivery (the tiered component) and generation (the flat component). The two right columns show the month-by-month calculations for the two different TOU rates.
The bottom line is striking: under TOU-A there is a savings of 5% over the tiered rate, whereas the savings jump to 19% by going to TOU-B! That is a savings of $600/year just by changing rate plans - a switch that any SCE customer can make.
MAJOR CAVEAT: YOUR MILEAGE WILL VARY!
The results displayed here are entirely dependent on your actual energy usage and no two usage profiles are alike. It is possible, even likely, that some usage profiles will see an increase in bills under either TOU option.
The good news is, that for a nominal fee, this is an analysis that we could do for any SCE residential customer - we would just need access to your usage data.
So that completes our pre-solar analysis. In our next post, we will look at how these results change when you add a solar power system into the mix.
05/04/12
Categories: All About Solar Power, PWP Rebates, PWP, Commercial Solar, Non-profit solar, Westridge PAC Project
Westridge Project Grabs Pasadena Weekly's Green Issue Front Page!
 Readers of this blog will know all about the 52.3kW solar project that Run on Sun just recently completed installing at Pasadena’s renowned Westridge School for Girls. Now that project has become the cover story in the Annual “Green Issue” of Pasadena Weekly.
Titled, “Solar Flair: New solar installation at Westridge School brings environmental lessons to life,” the piece features interviews with Westridge’s Head of School, Elizabeth McGregor, Facilities Manager Brian Williams, and three students who are part of the school’s environmental group known as the Green Guerrillas. The story reveals the school’s deep commitment to sustainability in everything from solar power to drought tolerant plants.
This first of what we hope will be many solar projects at Westridge really highlights the value of these projects for all schools, especially those in the Pasadena Water and Power service territory. Good rebates and a solar company that really understands your goals makes a solar power system installed by Run on Sun a “no-brainer.”
Contact us today and let’s get going with YOUR solar project!
Categories: PWP Rebates, PWP, Commercial Solar, Non-profit solar, Westridge PAC Project
The Permit Process - Installing Solar at Westridge - Part 2
In Part 1 of this series about Installing Solar at Westridge School, we looked at the process of putting our materials together for the rebate application. With the rebate safely reserved, it was time to turn to pulling the permits for the job. A solar project of this size involves two separate permits - building and electrical - but four points of inspection - fire, electrical, building, and utility. We had already provided the utility, PWP, with the materials they needed but now we needed to load up for the permit center.
Assembling the Necessary Materials
The permit process addresses an entirely different need than does the rebate application. The permit process is intended to guarantee that the proposed system, as designed, satifsfies all applicable codes and standards. In theory, once you have successfully pulled the permit, the inspection process should simply be a matter of showing the inspector that you built the system as it was approved when you pulled the permit.
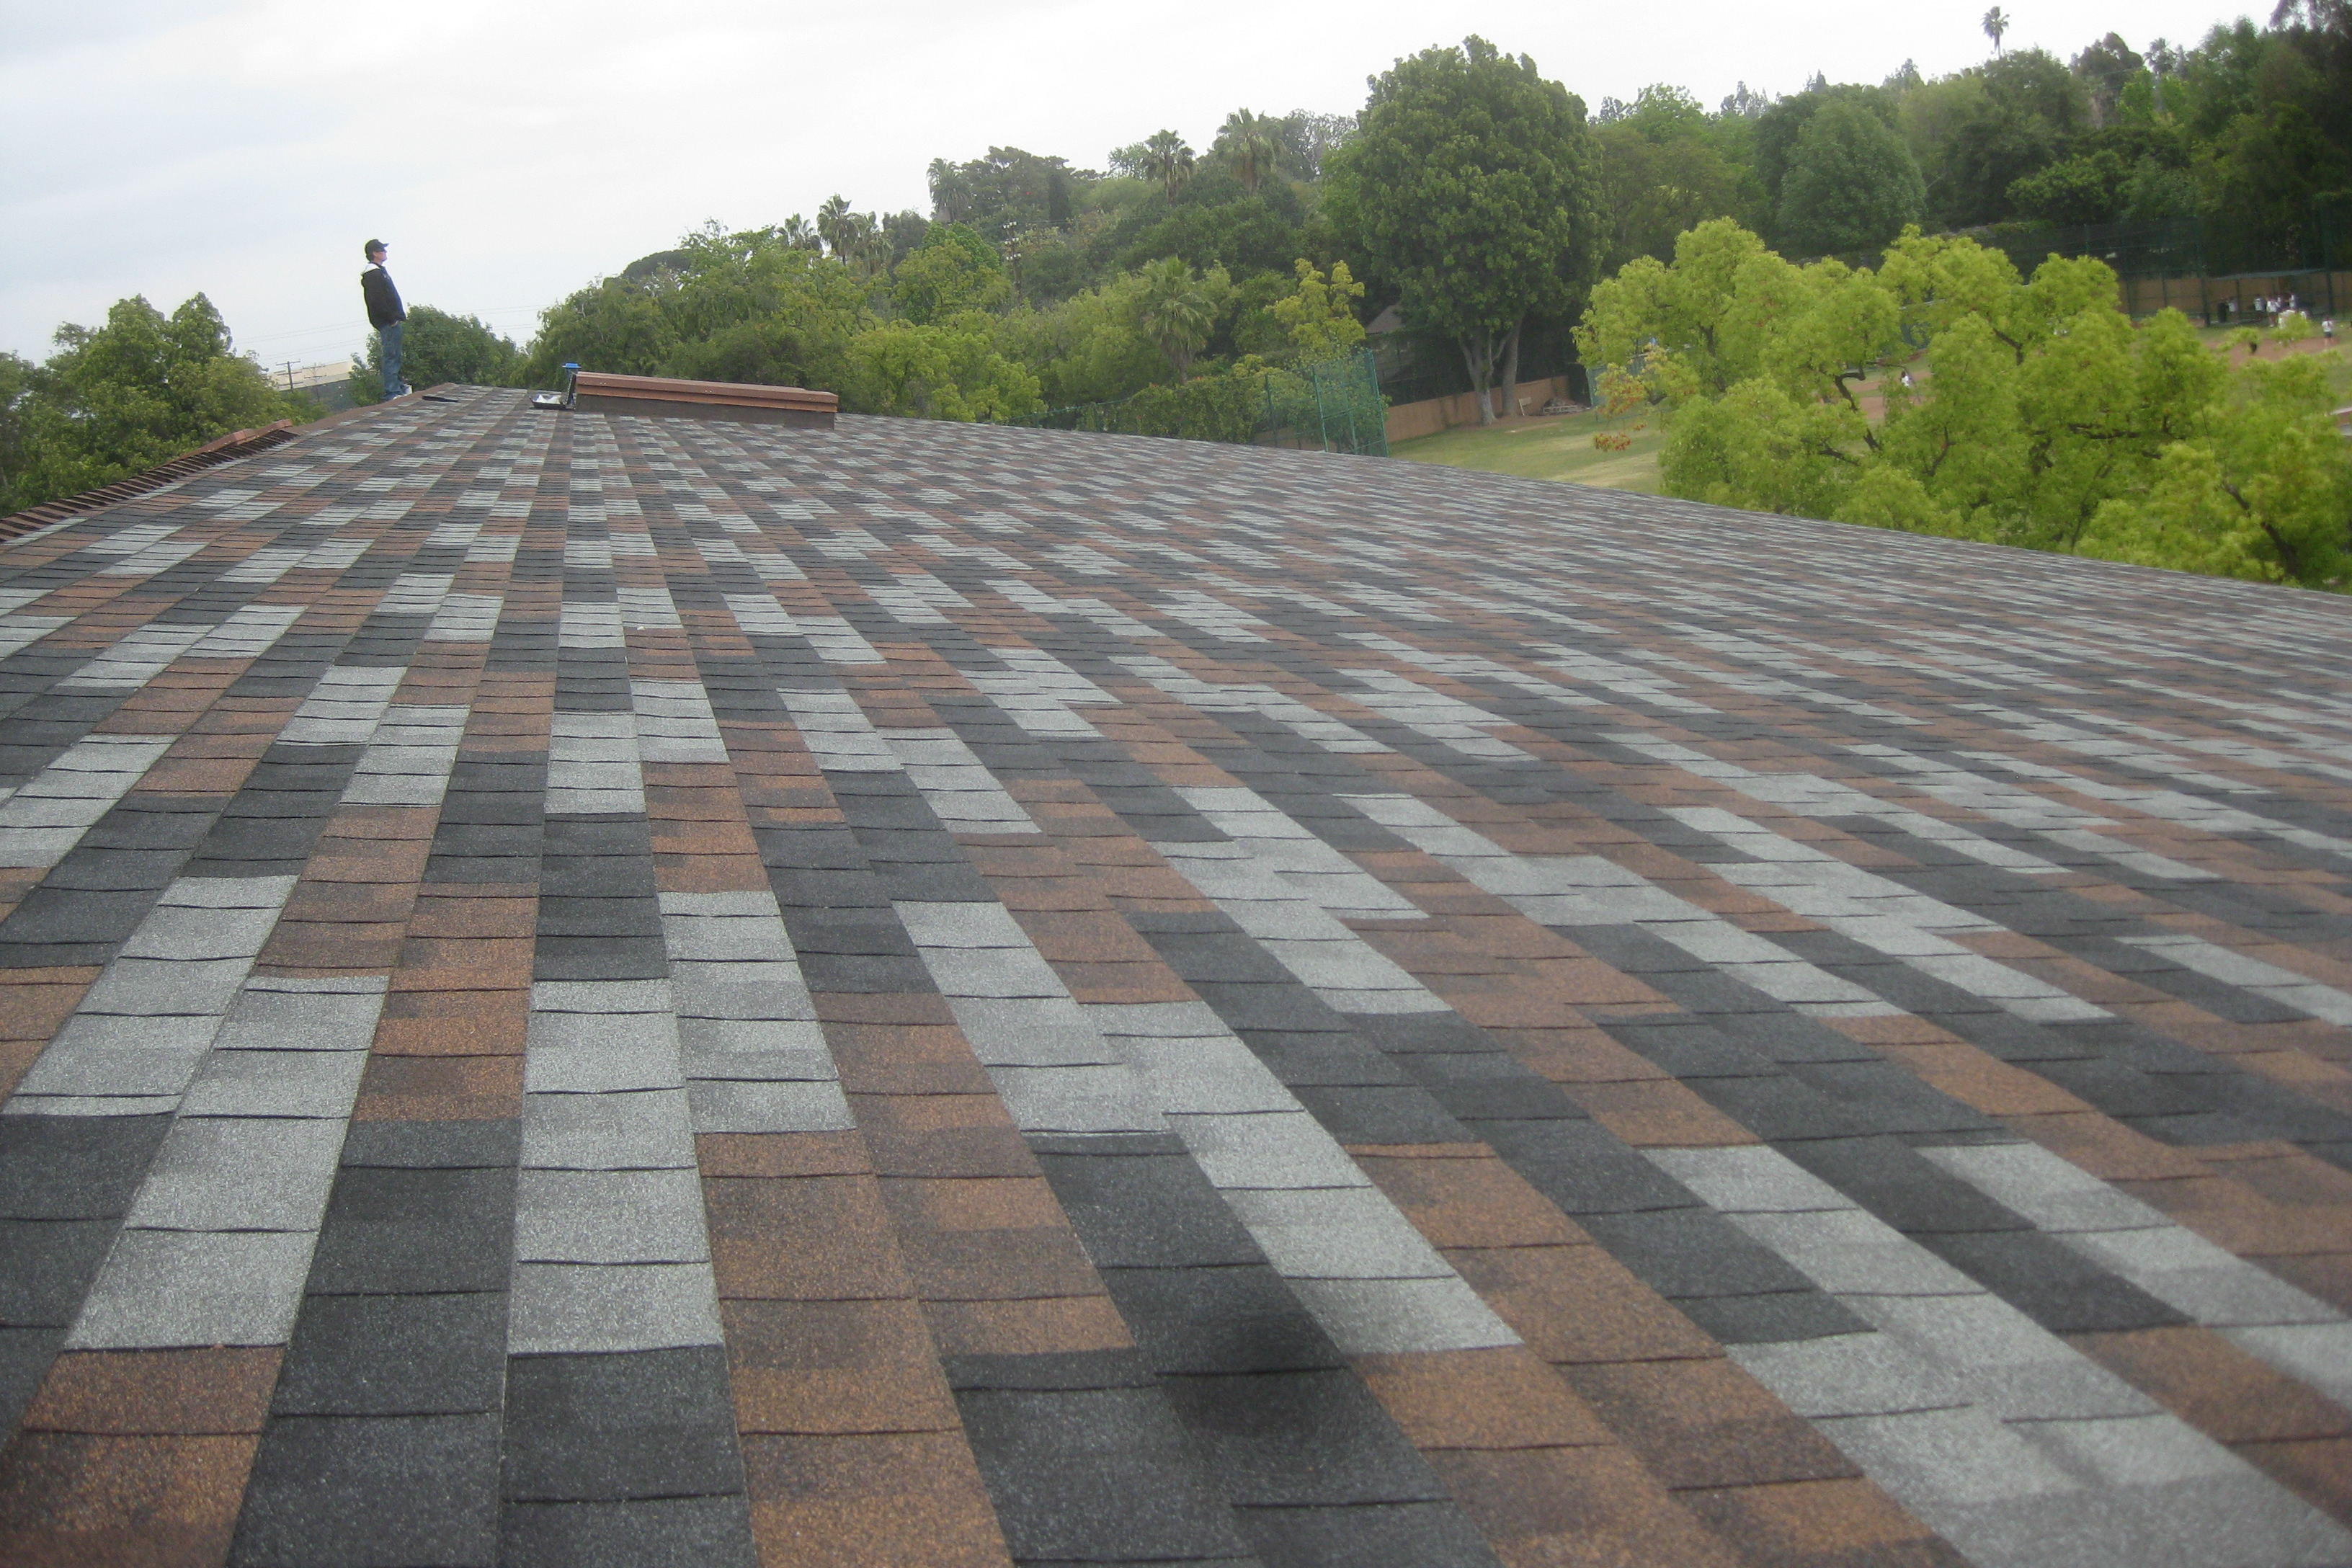 It looks conventional enough!
This project presented one signficant challenge - the actual attachment of the system supports to the roof. While the roof looked conventional enough, that was not a wooden truss underneath those shingles. To the contrary, our roof was built from a 20 gauge “Type B” steel deck with two layers of 5/8″ plywood, followed by 3″ of solid foam insulation, followed by 3/4″ of plywood to which the roofing materials themselves - membrane, felt and shingles - were attached. So the question arose: what would be a sufficient way to attach our standoffs to this roof to provide the requisite resistance to wind loads - the effect of which had recently been demonstrated in Pasadena in such a disastrous fashion?
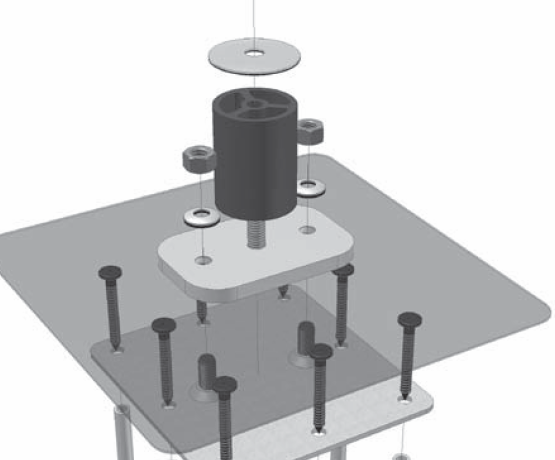 Unirac Fastfoot Attachment
To help answer that question we turned to the structural engineer (SE) who had originally done the load calcuations for our building. Could we use a “FastFoot” and simply put multiple screws into the wooden decking materials? Surely with enough screws - the FastFoot will allow for up to eight - we could reach the required pull-out resistance. Unfortunately, that wouldn’t work since the engineer could not guarantee the manner by which the plywood materials were secured to the underlying steel deck. In other words, while we could be sure that our array would remain attached to the plywood, we couldn’t be sure that the plywood would remain attached to the building! Images of Wizard of Oz roofs flying through the air filled my mind - clearly we would need another way!
The engineer suggested that we could use carriage bolts that ran all the way through the steel roof and were bolted together on the back side. Certainly such an approach would guarantee that our array and the roofing materials stayed connected, and indeed, you would have to separate the steel deck from the steel framework of the building for that method to fail. Unfortunately, that wouldn’t work either since there was no way to access the back side of the roof in order to complete the connection.
“Nine-Inch Nails” Meet 8-Inch Screws!

There was one other approach - a company by the name of Triangle Fasteners sells some very strong, very long, self-tapping screws (called “Concealor screws“) that could drill their way into the steel deck and provide us with the required pull-out resistance. The bad news - our distributors only sold screws up to 7″ long - and that would not be long enough to guarantee that our screws made it through the decking. A call to the manufacturer revealed that in fact, they did make 8″ screws, they even made 9″ screws! Excellent! We now had a solution that our SE could bless. It was time to go pull our permits.
Fear and Loathing at the Permit Center
Anyone who has ever pulled a permit knows the combination of emotions that you encounter upon entering the building: fear that something you haven’t considered will suddenly become A Really Big Deal, loathing for the interminable waiting, and of course, the pain of paying for it all. Dentists’ waiting rooms tend to be cheerier places.
Pasadena’s permit center is certainly better than most: it is a comfortable old building across the street from the beautiful City Hall. They have a clever scheduling system that routes you among the different windows: Building and Safety, Zoning, Historical Preservation (very big in Pasadena but not a factor for solar projects), Fire, Permit Processing and, last but certainly not least, the Cashier. A solar project applicant must navigate their paperwork through every one of those windows before exiting with your Grail - a stamped set of plans and a bright Yellow permit folder where inspection sign-offs will be recorded.
First stop - Building and Safety.
Building and Safety
The building and safety folks are responsible for reviewing your plans for conformity with state and local codes and standards - a really important task. First, however, you have to speak with someone who knows what you are showing them and on our first trip to the permit center, no such person could be found! The gentleman behind the B&S desk was very polite, and you could tell that it pained him to inform us that after our thirty minute wait, he couldn’t help us. Moreover, none of the people who “understood solar” were available - we would have to come back tomorrow.
Tomorrow dawned cloudy but we were determined to press forward. This time our 35 minute wait was rewarded with an appearance before someone who was prepared to pass judgment on our plans! We walked him through each of our sixteen 24″ x 36″ pages, explaining as we went exactly what we were doing and where the answers to his questions could be found.
All seemed fine, but then he started throwing us some curves.
Our SE had done his calculations for a basic wind speed of 85 mph - the same wind speed we had always used for load calculations in Pasadena.
“No,” said the man behind the desk, “You have to use 100 mph.”
“Really? Since when?”
“Since the windstorm in Pasadena at the end of November,” we were told. (Never mind that the wind speed never reached 85 mph in Pasadena, let along 100 mph, during that terrible event.)
“Really? Where was that published?”
“It wasn’t,” he conceded, but simply told us that we needed to revise our calculations for 100 mph or he wouldn’t approve them. That meant another iteration with our SE and another trip back to the permit center.
Now the good news here is that we were certain that our system would easily handle 100 mph winds (or 120 mph, for that matter) so this change in policy did not pose a danger to the project going forward. But changing the basic wind speed for an area from 85 to 100 mph is something of a big deal and will add to the expense of many projects that need permitting. Shouldn’t there be a more public process before such a change is implemented?
The other curve sent our way was really just odd.
We did a detailed drawing showing our attachment method as it penetrated the various layers of roofing materials and made contact with the steel deck beneath. We drew that straight up on the page and included multiple elevations in our sixteen pages that showed the pitch of the roof and indicated that the array was installed on top of our attachment method, parallel to the roof.
“Not good enough,” we were told.
“Why? What’s missing?”
“You need to show the attachment at the slope of the roof.”
“Really? We show you the slope of the roof, we gave you the detail of how the attachment connects to the roof and we told you that the array is parallel to the roof. How is that not sufficient?”
“You need to add a drawing that shows the array attachment and which reflects the slope of the roof.”
“Really? So what you want is for me to rotate the image of our attachment 13° to reflect how it will be pitched on the roof?”
“Yes.”
Sigh. Ok, back to the drawing board (or more accurately, the computer screen).
Fortunately, our SE was able to redo his calculations in short order. And not surprisingly, it was also pretty easy to take our attachment image and rotate it. We printed up the revised plans and headed back to the permit center.
Surprise - there was yet another person behind the counter this time. Whereas his predecessor seemed to be actively looking for little things to complain about, this fellow could not have been more helpful. He looked at our revised load calculations - veryifying that they had been done for 100 mph and that the SE had concluded that all was well - and then proceeded to stamp our plans. (I had pointed out our added, rotated drawing, but it was clear that he wasn’t interested in that at all.) After he stamped our plans, he then took them himself to the zoning and historical preservation desks and secured those sign-offs as well! Wow! He saved us an hour of waiting in those queues and he seemed genuinely helpful and concerned. What a pleasant contrast! We were well on our way with just one real substantive hurdle remaining - the Fire department.
Fire
The California State Fire Marshall developed a set of guidelines that provide guidance as to how fire departments should permit and inspect solar installations. The guidelines call for space to be set aside for pathways around the array and for venting of smoke in case of a fire. The guidelines call for different restrictions based on the size and shape of the roof and whether it is a residential or commercial building.
(While the document from the Fire Marshall is labeled “guidelines", most localities seem to treat it as gospel. Even more curious, the guidelines clearly say that they are just that, guidelines that do not have the force of law until a local jurisdiction passes an ordinance adopting the guidelines as regulations. We have yet to see such an ordinance.)
Our building plan included a three-foot set aside around both sides of the array and from the ridge, and was augmented by automatic smoke ventillation devices already built into the roof. But that was not sufficient - the fire official wanted us to provide a four-foot clearance on all three sides. Yet another trip to the computer.
We returned with our revised drawing, showing four feet of clearance as requested. But now there was another concern - the same fire official now wanted us to open a walkway in the middle of the array. (We already had access paths for potential maintenance, but they were not wide enough to be considered a walkway.) No matter that our roof was not at all like the flat roof with parapet shown in the guidelines, we still needed to provide a walkway. There was only one way to do that - take out a column of panels. Together we X-ed out seven panels and thereby created a walkway. The fire official was now satisfied - she signed off on our plans.
Done
And just like that, we were done. Well, not quite - there was still the little matter of paying for all this. Here we made out surprisingly well. Unlike some cities that gouge solar applicants (and you know who you are!), Pasadena’s fees were quite reasonable. Total cost for our now 52.25kW solar project? $732. Sadly, we know of residential projects one tenth that size in other cities where the permit fees have exceeded $1,000! (But that’s a story for another day.)
Altogether, it took us four separate trips to the permit center, three plan revisions, and a little over $900 in expenses to secure our permit.
Now all we needed to do was get the materials to the job site on time, and complete the installation in the two week window that we had to mesh with the School’s schedule. The real work was about to begin…