Tag: "enphase"
02/17/17
Categories: Solar Economics, Residential Solar
I've got solar; why is my bill so high?
 Every now and then we get a call from someone who has solar installed at their home but they’re not happy. Typically this occurs when they get their “true-up” bill at the end of the year, and are shocked to see that the amount that they owe is way more than they expected! In many cases this leads them to believe that the system simply isn’t working, and now they want a third-party (like Run on Sun) to come out and evaluate the performance of their system.
Here are the three leading reasons why that bill is so high…
Your system just isn’t working!
Although this tends to be the number one suspected reason for why the bill is so high, generally it isn’t the actual cause. Most systems are installed properly and are in operation. But every now and then we come across a system that simply isn’t working at all. That was the case with one man who was convinced that his system had never worked and that the company that installed it was simply out to cheat him. We didn’t see signs of that—the system had been installed and the overall workmanship was acceptable on the surface, so it wasn’t like someone just slapped the panels on the roof and ran away. But here’s the thing—this was an Enphase system so there should have been monitoring in place to answer the question of how well the system was working. Except that the installer had never bothered to complete the setup of the monitoring system!
When we came out we were able to access the Envoy directly, and while it could see the microinverters, it was clear that they had never produced any power—in over a year!
So how can a solar system owner prevent this? Simple—when your system goes live, make sure that the installer walks you through the operation of the system so that you can see with your own two eyes that the system is actually producing power. (This could be a readout on the inverter/monitoring system, or a spinning performance meter, or an indication that utility meter is going backwards.) Better yet, ask them up-front how will you be able to know that your system is working, and then when it goes live, make them prove it to you!
If you believe that your system isn’t working, and you live in the greater Pasadena area, give us a call at 626-793-6025, or email us to set up a service call!
Your system is working, but…
This second case is actually far more likely: the system is performing, but it is not meeting your savings expectations. In our experience there are two main reasons for this: hype and over use.
Beware the hype
One reason for this disconnect is that a dishonest sales person over-hyped the savings to be had from the system installed. For example, we have seen “savings” projections based just on the size of the system, without regard for how shaded the system was, or its orientation - to say nothing of the actual rate structure that is being used by the utility.
Shaded systems produce less energy. Systems aligned away from South will produce less energy. A utility customer on a time-of-use rate structure may well save less than one on a tiered rate structure (depending on how those rates are designed).
The point is to beware of overly simplistic savings projections. A proper analysis will factor in all of these issues to provide the best possible estimate of savings.
Solar is not a silver bullet
Even the best savings projection is predicated on future energy usage being consistent with the historical data that the solar company was given (unless increases are specifically discussed and included). While many people with solar power systems become vigilant about reducing their overall energy consumption, others go in exactly the opposite direction. Indeed, it is not uncommon to hear people say that part of why they want to “go solar” is so they can afford to run their air conditioning “more” during the summer.
Solar power systems are finite resources—they can only produce so much energy consistent with the size of the system, and most utilities limit system size to the historical energy usage average at the site. If you install solar, but then triple how much energy you use during the year, you shouldn’t be surprised if you are not saving any money!
What we have here is a failure to communicate!
Which leads us to the most likely culprit—there has been a failure to communicate between installer and consumer. At the root of this is Net Metering and the complexities of most energy bills. (A big part of the blame here goes to the utilities who seem determined to make their bills as complicated as possible!) Let’s provide an overview of this issue and then illustrate with a specific example.
How Net Metering Works
Solar system owners - at least here in SoCal - operate under utility rules known as Net Energy Metering, or just Net Metering for short. Here is how this works: on the day when your solar power system is given “Permission to Operate” (or PTO) by the utility, your billing will shift to Net Metering (often the utility will change your meter to allow for that switch). Every day, as your system operates, you will either be exporting (selling) energy back onto the grid, or importing (purchasing) energy from the grid.
Think of it this way: you get up at 6 a.m. and it’s dark outside. You turn on some lights, the radio, coffee maker, etc. Your solar system isn’t producing anything (it’s dark outside, remember?) so you are purchasing energy from the grid. You go off to work as the sun comes up, and your system turns on. All day long, your solar system is producing energy, but there is no one there to use it—the A/C is off, the TV is off, the house is dark—so all of that excess energy is sold back to the utility. Your fancy new meter keeps track of all of that energy coming and going.
Every billing cycle the utility will look at those readings—how much energy did you sell compared to how much did you purchase—and “net” out the difference. If you were a net seller of energy, you will have a credit. If you were a net purchaser of energy you will have a balance due. But here is where some people get confused—your bill won’t ask you to pay for the energy you used that month. Typically you will only be charged for whatever “customer charge” there may be along with taxes and other fees. The bill for your energy usage (or credit, if you are so lucky) is carried forward to the next billing cycle, and the next, and the next, until you get to the anniversary of your PTO date. Now your usage will be “trued up” and you will either get a bill to pay (assuming that for the year you were a net energy purchaser) or a check (assuming you were a net energy seller, but don’t get too excited because that payment is really tiny).
Here’s the thing, depending on how much of a net energy purchaser you were, that bill could be pretty significant, in some cases well over a thousand dollars or more!
Of course, you would have been receiving bills every cycle that showed what you were accumulating (either a balance due or a credit) but since there is no related payment required, it is easy for some to overlook those bills, and if this process has never been explained—or even if it was but the consumer simply didn’t “get it” at the time—this can lead to a nasty surprise.
Bottom line - solar companies need to do a better job here in explaining how this works. (Hence this post!)
A real-life example
Consider a hypothetical solar system owner, let’s call him Bob. Now Bob is a smart guy, but this is the first solar power system he has ever owned. His installer explained everything to him when the system went live, but Bob was distracted by the excitement of a potentially zero bill. His system has Enphase microinverters so he has been receiving energy production emails from Enphase every month, and that looked cool, but he never attempted to reconcile his Enphase report with his utility bill (Bob’s not so big on balancing his checkbook, either). But to be fair to Bob, the Enphase report that he receives is for each calendar month, but his billing is every two months, and they aren’t calendar months; rather, they run from meter read date to meter read date (e.g., 7/28/2016 to 9/26/2016).
The good news is that Enphase has a reporting feature that allows you to enter any two dates since the system went live and receive day-by-day energy production, with the total at the end. Let’s see what we can learn when we put Bob’s billing data next to his production data from the Enphase reporting feature:
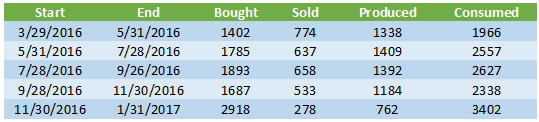
Ten months of Bob’s usage versus production
The first two columns show the start and end dates for each meter reading/billing cycle. The bought column is the amount of energy that Bob purchased from his utility. (Whoa, what happened during the latest billing cycle???) The sold column is the amount of energy that Bob sold back to his utility during that period, as reported by the utility. The next column is the amount of energy that Bob’s system produced during the dates in the billing cycle, according to the Enphase website. But wait, how can this be? In that first period, the utility says that Bob only sold 774 kWh of energy, but Enphase says his system produced nearly twice as much, 1,338 kWh!
How do we make sense of this disparity? The answer is simple: local consumption. It is important to remember that the utility has no idea how much energy Bob’s system is producing, all they see is how much energy Bob is selling back to them. So both Enphase and the utility are correct, they are just measuring different things. Enphase measures total energy produced. The utility measures energy sold to them—the difference is energy used to power Bob’s house that didn’t come from the utility; rather, it came from the solar system! In that first billing cycle, Bob’s system produced 1,338 kWh and of that, 774 kWh were sold back to the utility, meaning 564 kWh of that production were used to power his house. And that means that Bob’s total consumption for the month is the amount that he bought from his utility, 1,402 kWh, plus the solar production that was consumed locally, 564 kWh, for a total consumption of 1,966 kWh. Applying that reasoning to the rest of the data shows that Bob’s overall consumption has increased in every billing cycle except one, with a whopper over the holidays! (Maybe too many holiday lights?)
The production data shows that Bob’s system has been performing appropriately - increasing over the summer months, decreasing over the winter months. Here’s a graph that puts that all into perspective:
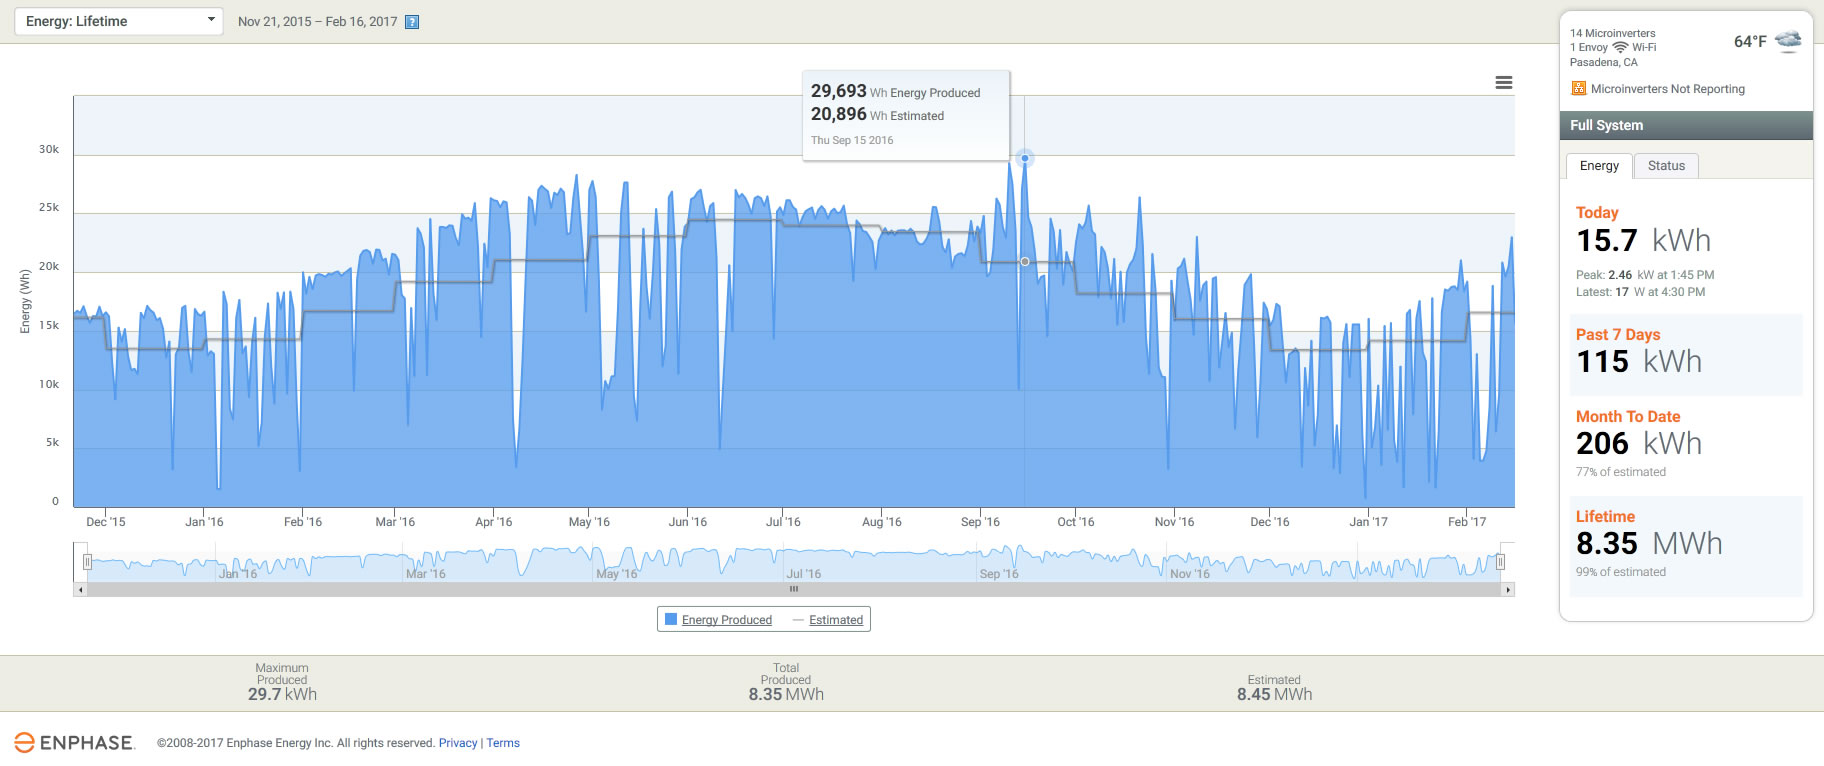
Bob’s solar power system: Lifetime energy production versus expected.
The blue represents the actual energy produced each day. The gray line is the predicted system production (in this case modeled using the CSI calculator). Over the lifetime of the system, the maximum amount of energy produced in a day was 29.7 kWh (42% above what was predicted for that day) and on the day when this graph was created, the system produced 15.7 kWh.
Generally, the performance peaks well above what is expected (particularly in the late June through early November period). But once we get into mid-November things deteriorate—not because of a fault in the system, but because of abnormally wet weather here in SoCal (as we head into a 1″/hour rain storm today!). For much of the past two months, actual production has fallen well below what was predicted, with just 77% of predicted being realized so far this month. And yet, despite all of that, overall the system has still produced 99% of its estimated lifetime production.
This points out a couple of key things to me: First, you just gotta love the data that is available through the Enphase monitoring system. It allows system owners and installers alike to have near-real time access to system performance, as well as to review long-term data to discern trends and uncover patterns. Priceless!
Second, we as solar professionals need to do a much better job of informing our clients so that they know what to expect. (I’m leaving out the hype-sters who couldn’t care less what the consumer knows as long as they make a sale.)
We live with this stuff every day but for most of our clients, this is all brand new, and confusing. We need to take the time to explain how this works so that they can understand the actual value of their investment.
07/02/13
Categories: PWP Rebates, Commercial Solar, Non-profit solar, Westridge PAC Project
Westridge Case Study: Part 2 - Run on Sun Gets it Done!
In Part One of this three-part Case Study we learned how Westridge School chose Run on Sun as their solar contractor. Here in Part Two we focus on the actual process of the installation as seen from the client’s perspective.
Run on Sun Gets it Done
With the paperwork filed and the rebate secured, Run on Sun had a very tight window — less than two weeks in April 2012 — in which to install and connect all 209 solar modules and get the monitoring software up and running. The goal was for the project to be completed and operational by the time Westridge students returned from Spring break, so time was of the essence.
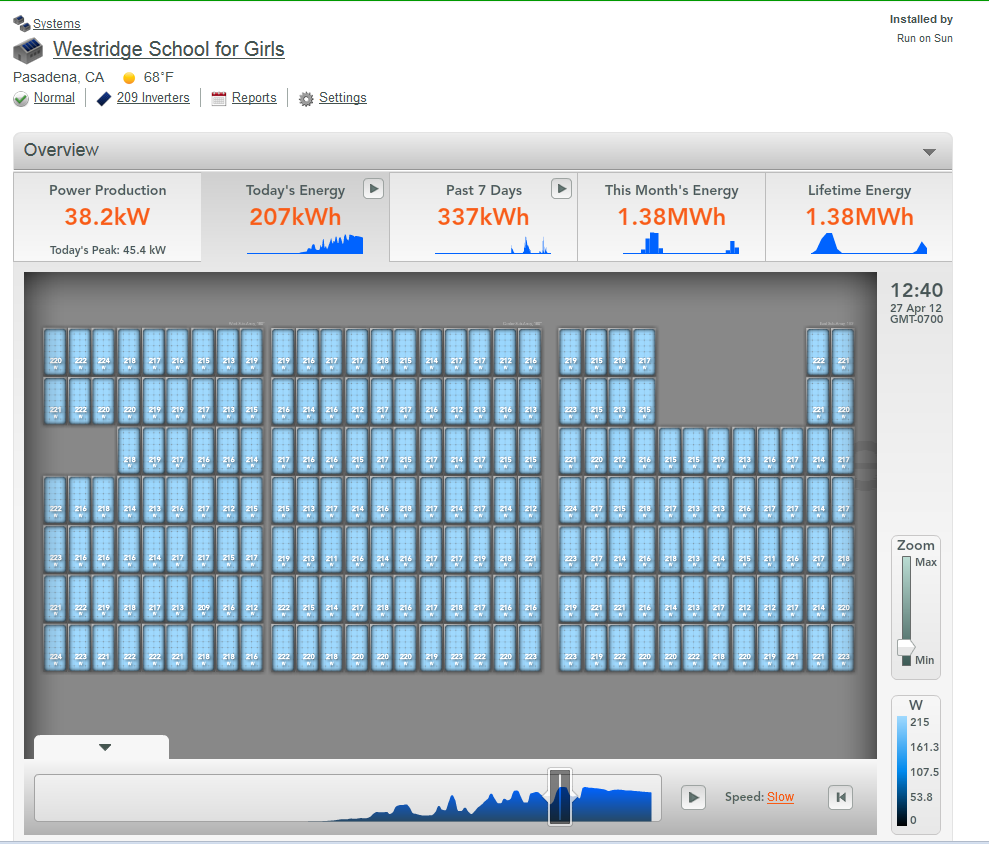 For the rooftop display Run on Sun used a microinverter system supplied by Enphase Energy, which allows customers and solar installers to track the output of the modules, individually or collectively, from the convenience of their computers, iPads or smartphones. This software was a selling point for the school, because it would make the technology accessible to students and allow teachers to creatively incorporate aspects of the solar system’s performance into classroom instruction.
The modules were grouped into three sub-arrays that formed a larger circuit. Under each module, a microinverter was installed to convert DC energy gathered from the module into AC power, which could be combined and fed back into the school’s electrical service. The 1:1 ratio of microinverters to modules allows for a more detailed readout that lets users know the output of each module and gives an easy-to-read display should anything ever go amiss, from a connection issue to dirt on the module’s surface.
Throughout the installation Williams remained on hand to oversee the work, though there were no delays and no change orders requesting funds beyond what had been originally estimated. Within the assigned two-week period, Run on Sun had completed the project on time, and everything was in working order.
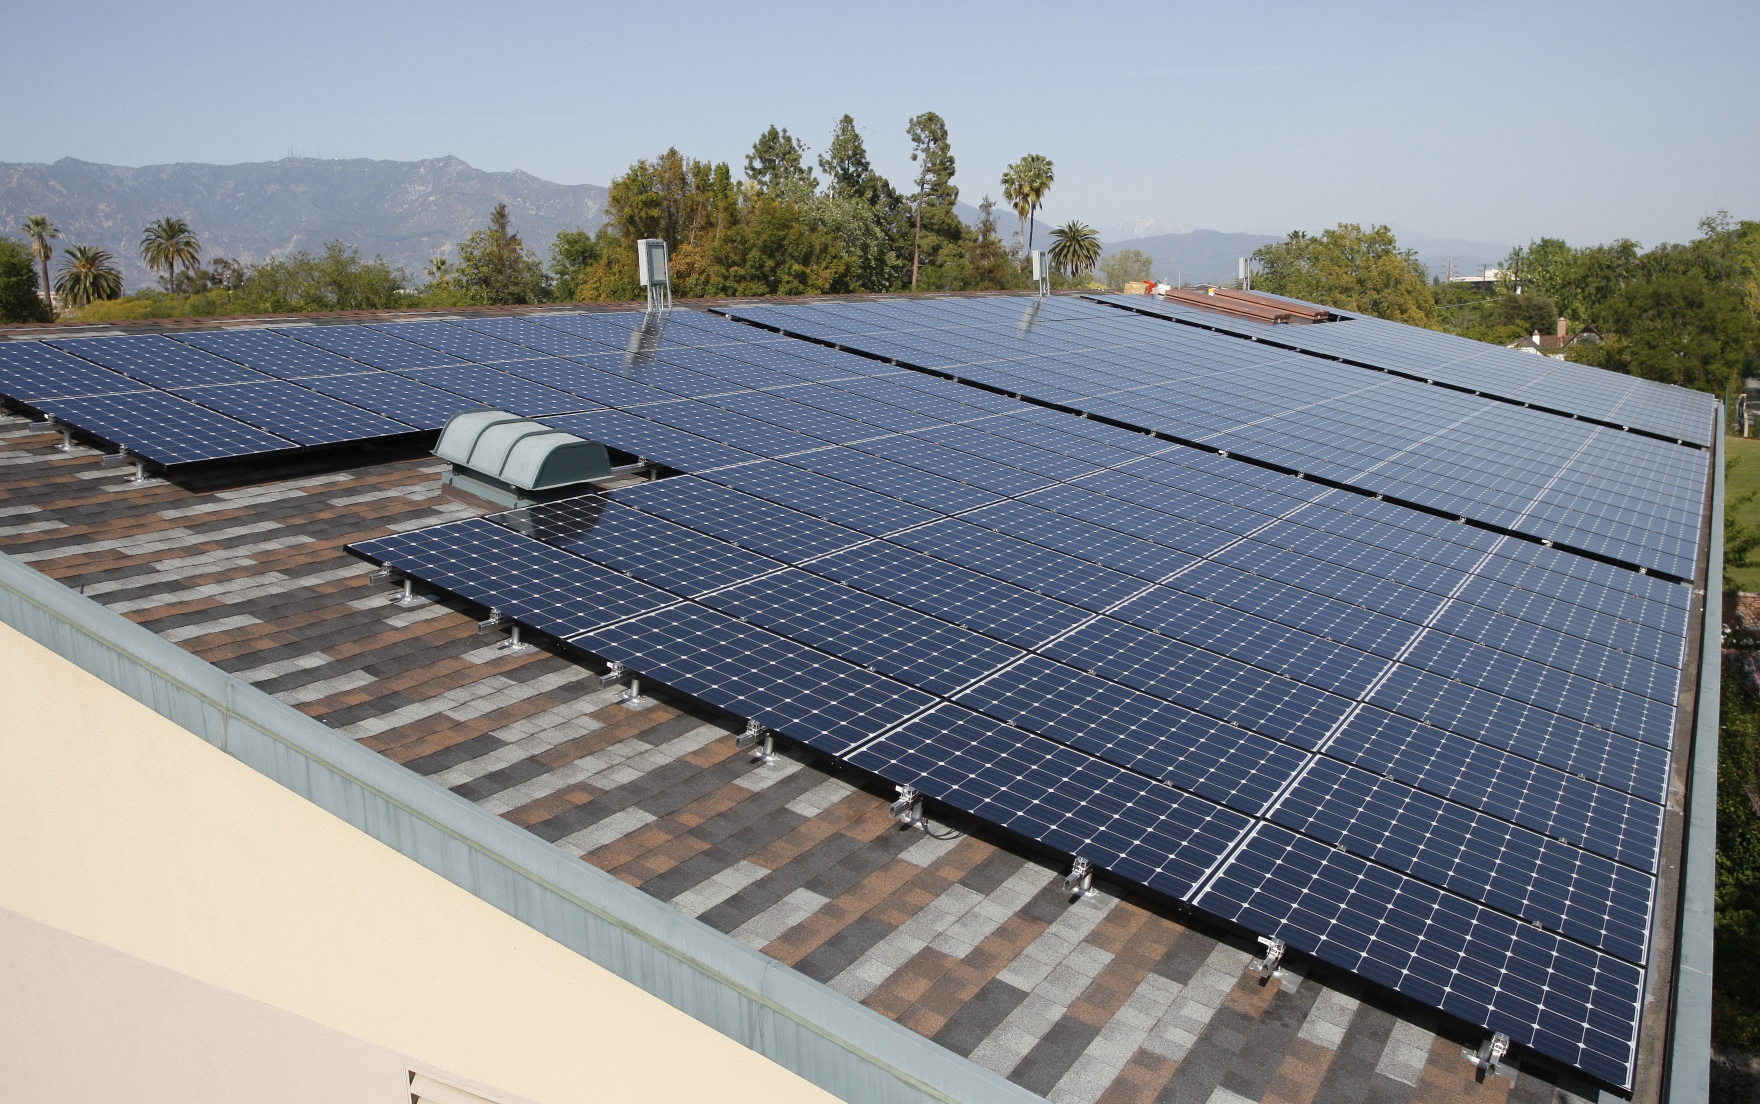
A Picture-Perfect Roof, Perfected
“I’ve worked with a lot of contractors, and I can honestly say, in this situation, this was one of the most seamless projects we’ve ever completed,” Williams recalls. “They were here early on the first day and, boom, they got it. It was done on schedule, at the price they said and signed off by the city. I wouldn’t hesitate to do a project like that again.”
A Truly Happy Anniversary
April 2013 marked the one-year anniversary of Westridge School’s solar installation, and Williams reports the system is running smoothly. The Enphase software makes it easy for officials, teachers and students to monitor the activity of all 209 modules, but Run on Sun also keeps a close eye on the operations and reaches out if and when an anomaly is detected. In the event that an outage or a decline in energy production should occur, the company promptly notifies the school.
For example, when one of the modules stopped reporting and apparently needed to be replaced, Run on Sun immediately contacted Williams to schedule a visit. The rest of the modules were still in full working order, and upon close inspection it was revealed that a connection had come loose. Still, to ensure maximum performance, the company replaced the microinverter at no cost to the school.
Another time Williams received a notification email from Run on Sun after the campus Internet connection had been temporarily cut during some service upgrades. And when the energy dipped from its norm of exceeding system predictions to 98 percent of anticipated, a call came in with a recommendation to check the array for accumulated dirt. After a brief spray with a hose, the system was back to producing at maximum capacity.
At the one-year mark, the school became eligible to receive its first annual rebate from Pasadena Water and Power. This is the first of five annual rebates it will receive, the dollar amounts directly correlated to the system’s actual production.
When a technician came from the city to assess the energy output of the system, the school was excited to learn the results. The city’s readings gave some very welcome news, indeed — the energy generated by the installation was above and beyond the original estimate provided to PWP, and it looked like the first rebate would be larger than anticipated.
“He said, ‘You’re over your estimate,’ and that’s all we could ask for,” says a thoroughly pleased Williams. “To date, everything that was promised to us was delivered — plus.”
In terms of the amount of energy generated, the rooftop system has continued to outpace expectations. The school expected to see a return on its investment in seven years, but it’s shaping up to come in as few as six. Because of the installation, Westridge is using 30 percent fewer kilowatt hours and is seeing its bills reduced by thousands of dollars each month, in addition to the rebate. The overall savings is far greater than the cost of running the air-conditioner in the gym, the initial impetus for bringing solar to campus. To Williams, making the decision to go solar was a “no-brainer.”
“The neat thing about this is it runs itself. If somebody walks onto campus, they don’t know we have a 52 kilowatt solar system on campus,” he adds. “They don’t see it. It doesn’t impact anything. All you do is save money.”
We will conclude this three-part Case Study with Part Three - Advice for the Solar Reluctant.
The preceding is an excerpt from Jim Jenal’s upcoming book, Commercial Solar: Step-by-Step, due out this summer.
08/30/11
Categories: All About Solar Power, Solar Economics, SCE, Commercial Solar, Residential Solar, 2011
The State of Solar California - Part 2: Who's Hot and Who's Not?
Yesterday we wrote about our most recent foray into the California Solar Initiative (CSI) data and how that data revealed trends regarding the costs of solar in SCE’s service area during the first half of 2011. We continue today with a look into the equipment that was specified for these projects and explore who’s hot and who’s not.
CSI Data Generally and Equipment Specifically
As a reminder, our data set for this analysis consists of an extract from the CSI Working Data from 8-24-2011 that includes data for SCE installs where major status activity took place during the first half of 2011. That data set consists of a total of 6,306 projects of which 698 are “delisted” (meaning the project’s rebate reservation has been cancelled for some reason), 3,131 are “installed” (completed or in some stage of rebate payment) and 2,477 are “pending” (in some stage of the process from initial rebate application filed but no rebate claim yet filed). For today’s analysis, we will exclude the “delisted” projects from our data, leaving a total of 5,608 projects to analyze.
CSI tracks data about equipment used on projects in great detail. In particular, for every project, CSI allows for up to seven different panel manufacturers and ten different inverter manufacturers! So how many of our projects use multiple panels or inverters by different manufacturers? We would expect not many, and the data supports that surmise. Only 11 projects reflect two different solar panel manufacturers on the same project and in most of those cases the installer has substituted one solar panel for the one originally designated. (Indeed, one project reflects four different panels being identified to CSI for the same project, finally settling on what appears to be two 180 Watt panels plus six 175 Watt panels feeding a single string inverter - curious design, that!) Similarly for inverters, only 24 projects have two different inverter manufacturers specified and no project reflects more than two. Given that, our analysis will only look at the first specified panel and inverter manufacturer.
Solar Panel Trends
So what is happening with solar panels?
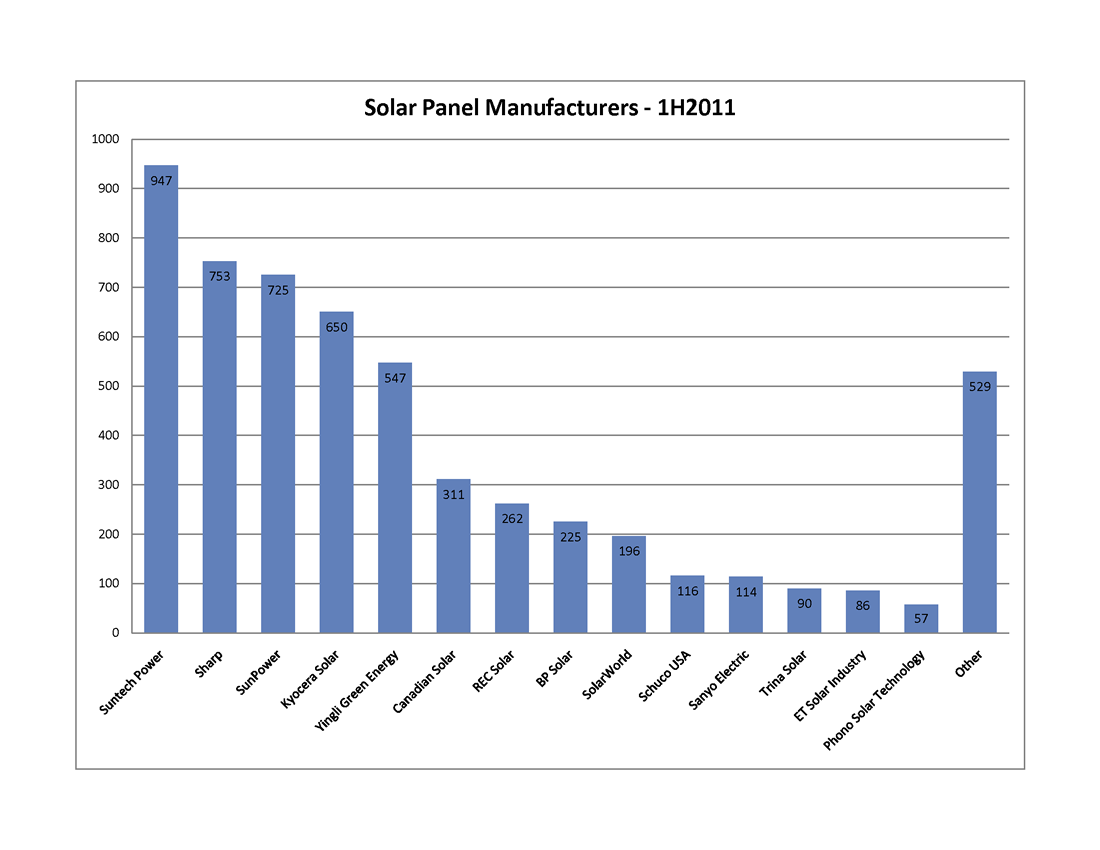 Overall, there are 85 different panel manufacturers included in the data; however, most of them account for very few projects. If we apply a reasonable filter to this data and only look at solar panels that appear in 50 or more projects, the number of represented manufacturers drops from 85 to 14, and the total number of represented projects falls from 5,608 to 5,079. In other words, those fourteen manufacturers account for 90.6% of all of our projects, as demonstrated in this first graph. In fact, the distribution is even tighter with only five manufacturers exceeding 10% of the total: Suntech Power (18.7%), Sharp (14.8%), SunPower (14.3%), Kyocera (12.8%) and Yingli Green Energy (10.8%).
Solar Inverter Trends
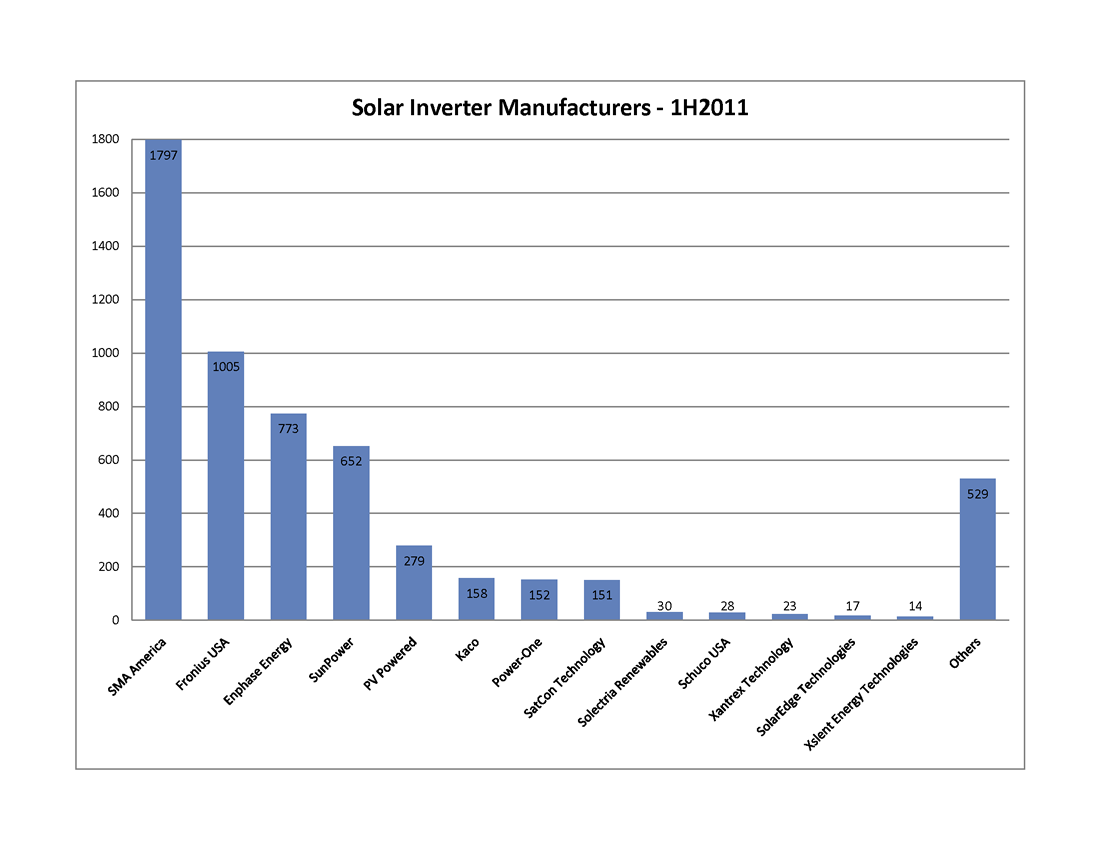
There are twenty-three different inverter manufacturers represented in the CSI data, reflecting the greater complexity of inverters and the more rigorous path required to bring an inverter to market in the U.S. Filtering for manufacturers represented by ten or more systems cuts the list from 23 down to just 13.
SMA America is the runaway winner in this competition. Under their own label, they account for 35.4% of all of these projects. Moreover, the majority, if not all, of the “SunPower” inverters are actually re-branded SMA inverters. When the SunPower inverters are added in, SMA accounts for a whopping 48.2%. That leaves only six other manufacturers to exceed even 1% of the total: Fronius USA (19.8%), Enphase Energy (15.2%), PV Powered (5.5%), Kaco New Energy (3.1%), Power-One (3%) and SatCon Technology (3%).
Two things of interest in those last numbers - the inroads of relative newcomer Enphase Energy (which was only founded in 2006), and the inclusion of SatCon, since alone among that list, it only sells central inverters for the commercial market (where it is dominant).
Popular Pairings
That is how the different manufacturers stack up head-to-head, but what about combinations? Are there pairings of panels and inverters that are most commonly preferred? The data reveals five combinations that account for more than 5% of the total: Suntech panels with SMA inverters (13.5%); SunPower panels with “SunPower” (i.e., SMA) inverters (12.4%); Sharp panels with Enphase micro-inverters (10.3%); Yingli panels with Fronius inverters (8.2%); and Kyocera panels with Fronius inverters (8.2%).
Winners and Losers
While certain pairings are popular - are they cost-effective and how well do they perform together? We decided to look at system combinations from an average $/Watt perspective and from an average CEC efficiency perspective to see what jumps out of the data.
Here’s the first thing that struck us - picking a system with lower-tier panels does not guarantee a lower installation cost. In fact, many of the bottom-tier panels (none of which made the cut in our discussion of panel manufacturers above) had install costs well above our overall average for the data set ($6.37/Watt). For example, we found a handful of systems using solar panels from such luminaries as Apollo Solar Energy, SET-Solar, and REC ScanModule where the average installation cost was more than $10/Watt!
Who was on the very low end of the install cost curve? Gloria Solar, Suniva, Kaneka, Silray and Solaria each had a handful of installations that were below $4.50/Watt.
More significantly, how did our most popular pairings perform? Here’s the data:
| Combination | Average Cost $/W |
| Suntech & SMA | $5.01 |
| SunPower & SunPower | $8.49 |
| Sharp & Enphase | $11.62 |
| Yingli & Fronius | $9.58 |
| Kyocera & Fronius | $9.79 |
What is up with the Sharp & Enphase combination? While Enphase installations are known to cost a bit more than a comparable string inverter installation (confirmed by our own experience), they certainly don’t cost $5/Watt more! Rather, it turns out that the overall average for all Sharp-based systems is $8.53/Watt (nearly $2.00/Watt above the average) with prices ranging from a low of $6.17/Watt (when paired with a Solectria inverter) to a breath-taking high of - are you sitting down? - $19.30/Watt when paired with a Sharp inverter. So who installed that system, you ask? You’ll learn all about it (or at least all that we can tease out of the data) later in this series.
Shifting our attention to efficiency, thin-film module maker First Solar gets the highest overall ranking, 91.7%, thanks to its extremely high STC to PTC ratio. On the more embarrassing end of the scale, Sunlan solar brings up the rear, averaging only 80.7%. From our list of the most popular solar panels, Sanyo (long a Run on Sun favorite) does the best, averaging 89.3% across a variety of inverter combinations. The rest of the top five are: Canadian Solar (87.6%), SunPower (87.5%), Suntech (87.2%), and Schuco (87.0%). The bottom-five of our best selling panels? That dubious honor belongs to: Sharp (86.0%), BP Solar (85.8%), ET Solar Industry (85.6%), Trina Solar (85.5%), and REC Solar (85.1%).
As for our five most popular pairings, here is the data:
| Combination | Average System Efficiency |
| Suntech & SMA | 87.2% |
| SunPower & SunPower | 87.1% |
| Sharp & Enphase | 85.2% |
| Yingli & Fronius | 85.6% |
| Kyocera & Fronius | 86.0% |
That is a pretty tight grouping, with a total range of just 2%. To break out of that mold with a conventional panel/inverter pairing, the Sanyo & SMA combination is your best bet, weighing in at 89.5%.
Who Uses What?
Finally, we decided to see what equipment combinations are preferred by the biggest installers in the market. The following table lists the top-five installers and reports the number of projects in the data, their most frequently chosen solar panel (and % of times used) and their most frequently chosen inverter (and % of times used).
| Name | # of Projects | Panel Mfr (%) | Inverter Mfr (%) |
| Solar City | 910 | Yingli (47.8%) | Fronius (95.5%) |
| Verengo | 688 | Suntech (91.7%) | SMA (81.7%) |
| Galkos Construction | 401 | Sharp (98.5%) | Enphase (99.0%) |
| REC Solar | 207 | Kyocera (42.5%) | SMA (75.4%) |
| Real Goods Solar | 165 | Kyocera (54.6%) | SMA (65.5%) |
Collectively, these 5 installation companies accounted for 42.8% of the projects in the CSI data. Certainly companies this large must have some real clout when it comes to negotiating prices, thereby allowing them to pass along those savings to their many customers.
Or do they?
Find out in our next installment!