Categories: "All About Solar Power"
05/04/12
Categories: All About Solar Power, PWP Rebates, PWP, Commercial Solar, Non-profit solar, Westridge PAC Project
Westridge Project Grabs Pasadena Weekly's Green Issue Front Page!
 Readers of this blog will know all about the 52.3kW solar project that Run on Sun just recently completed installing at Pasadena’s renowned Westridge School for Girls. Now that project has become the cover story in the Annual “Green Issue” of Pasadena Weekly.
Titled, “Solar Flair: New solar installation at Westridge School brings environmental lessons to life,” the piece features interviews with Westridge’s Head of School, Elizabeth McGregor, Facilities Manager Brian Williams, and three students who are part of the school’s environmental group known as the Green Guerrillas. The story reveals the school’s deep commitment to sustainability in everything from solar power to drought tolerant plants.
This first of what we hope will be many solar projects at Westridge really highlights the value of these projects for all schools, especially those in the Pasadena Water and Power service territory. Good rebates and a solar company that really understands your goals makes a solar power system installed by Run on Sun a “no-brainer.”
Contact us today and let’s get going with YOUR solar project!
02/05/12
Categories: All About Solar Power, Residential Solar, Safety, Ranting
Think Solar is DIY? Think again!
The Web is littered with sites proclaiming the benefits of solar as a Do-It-Yourself project and we have previously written about the perils of trying to do solar yourself. But the recent windstorm in Pasadena provided dramatic proof that some things in life should be left to the pros - and solar is one of them.
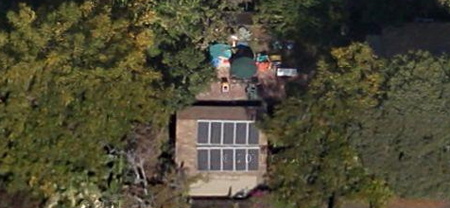
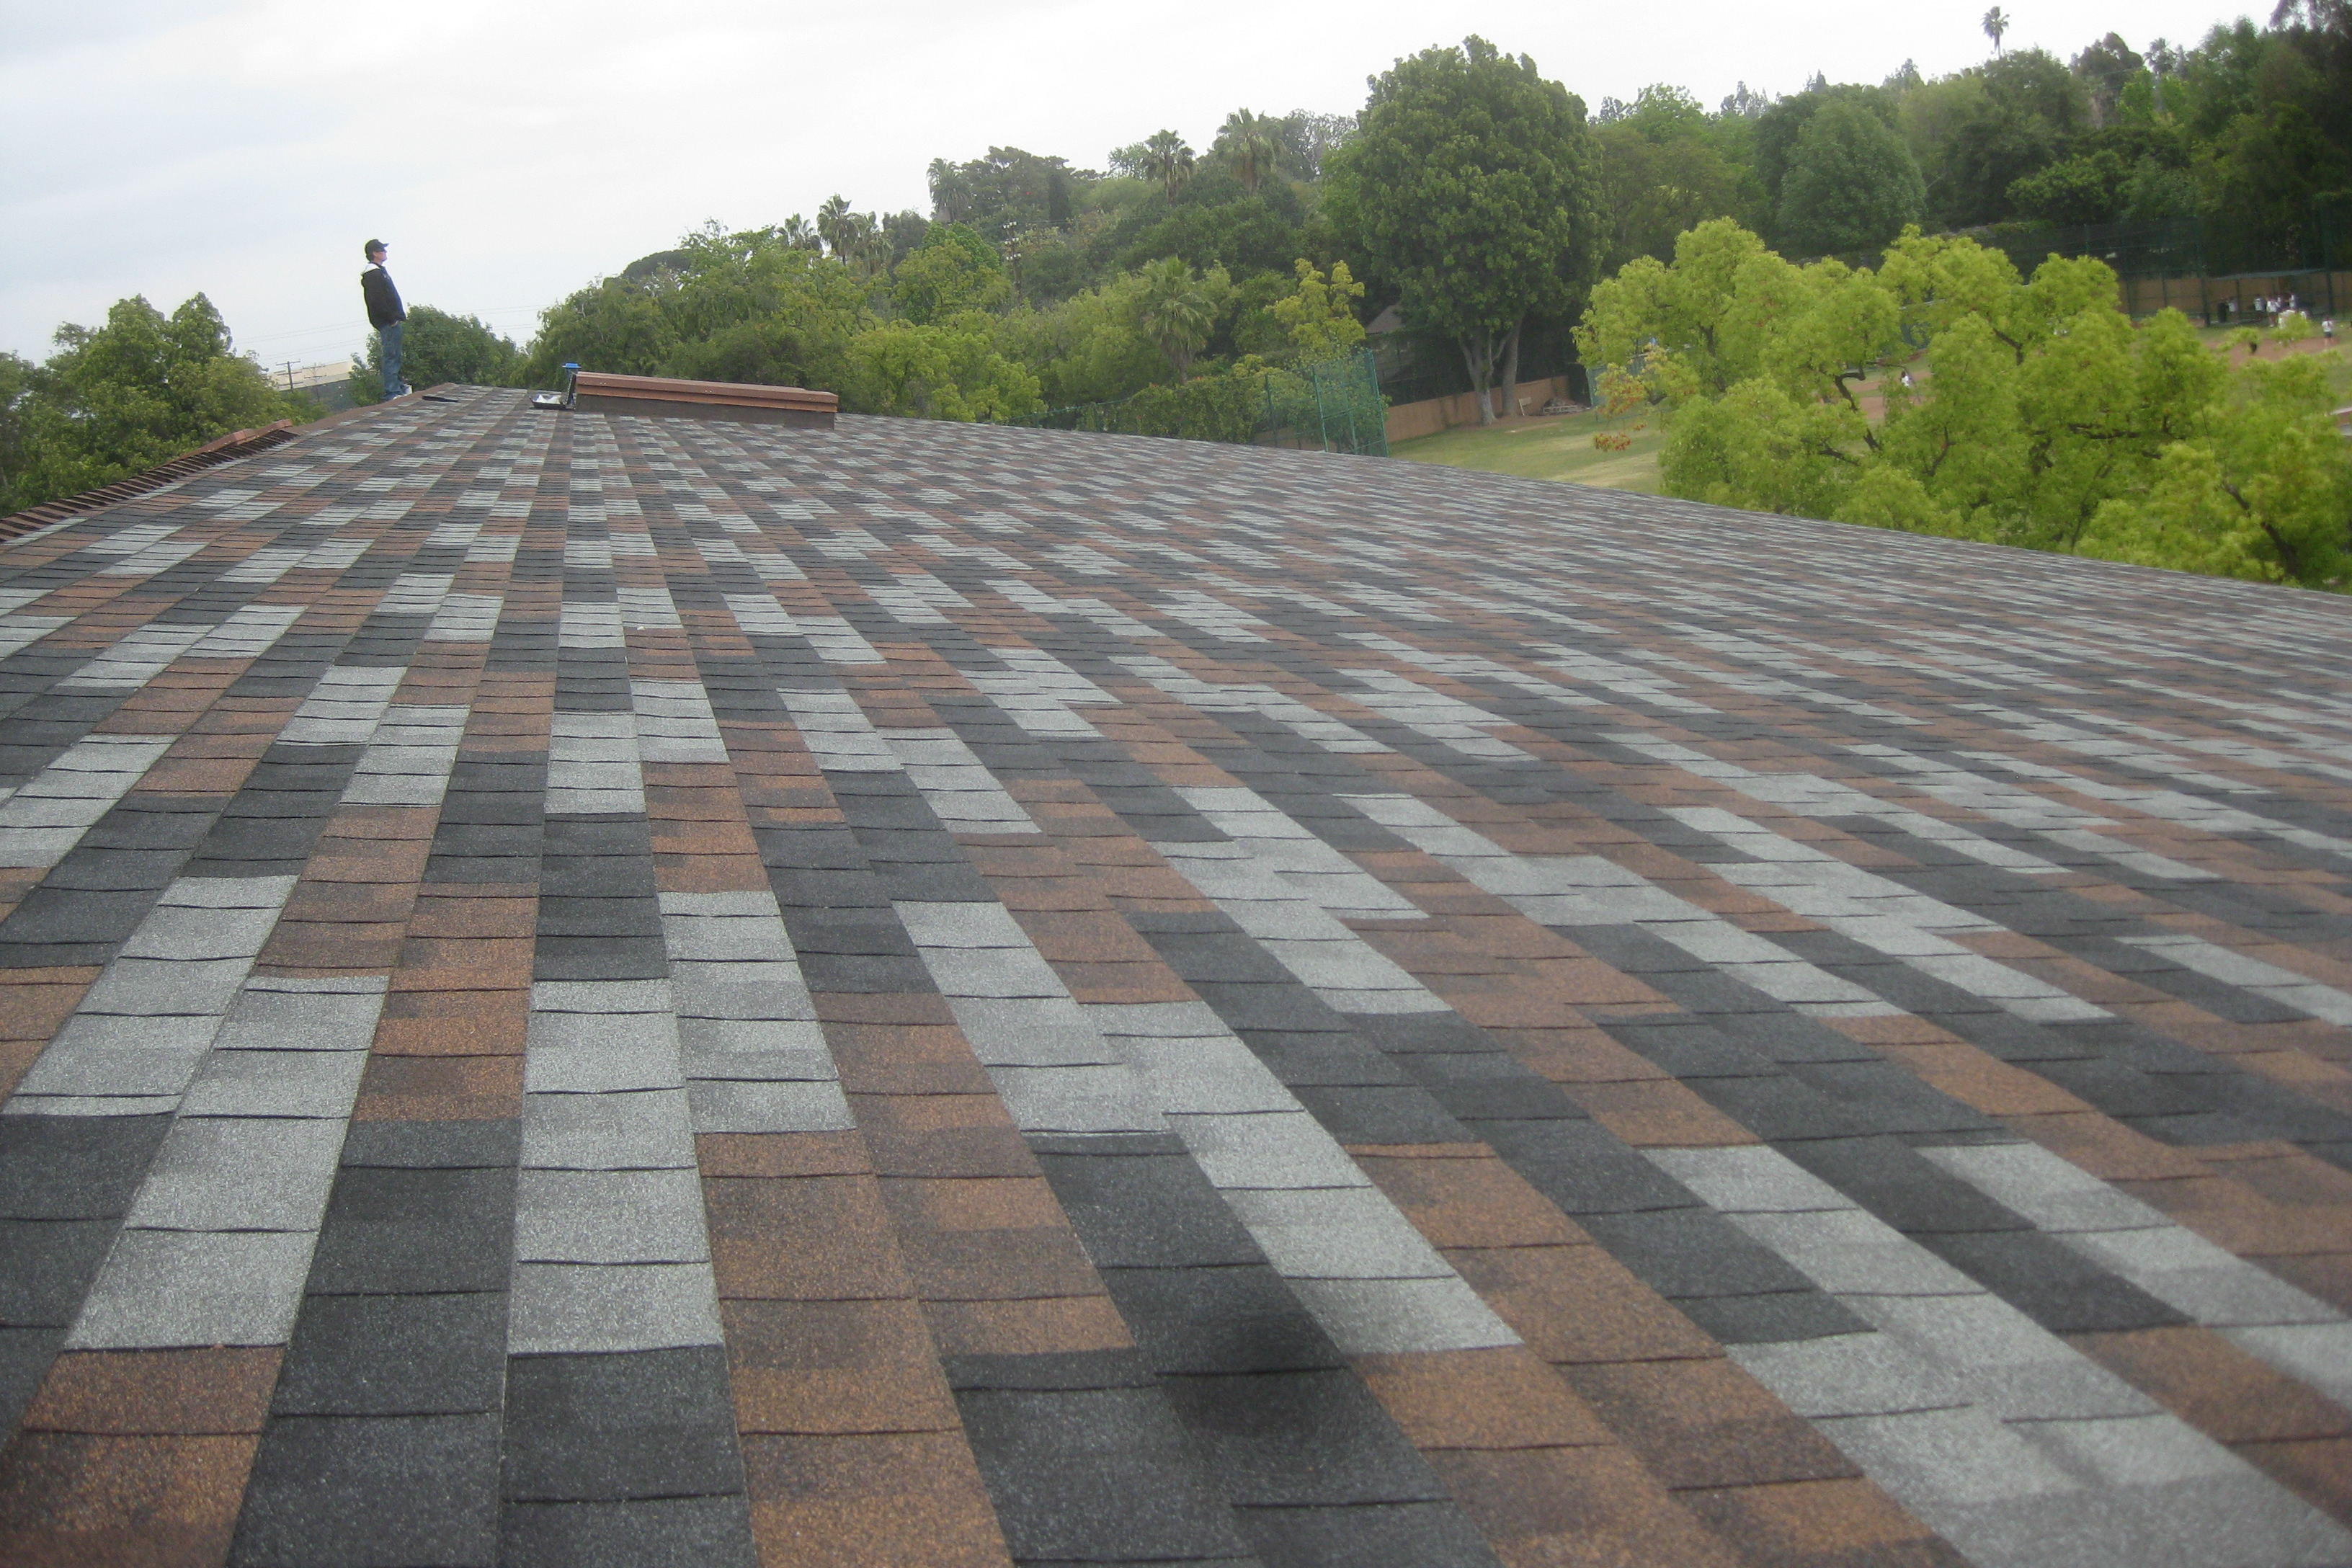
Take this installation for example - in a lovely part of Pasadena, the previous homeowner designed and installed this system which had a number of significant problems from the get-go. Here is the view of the site from the north looking south:

The panels that are mounted on the garage go all the way to the ridge, exposing them to higher wind forces. There are enormous trees to the west and south-east that will provide significant amounts of shade. The panels on the main roof (that mostly shaded shiny spot in front of the palm tree) are even worse as they are directly facing the tree to the south. Indeed, from this view from the south, the panels on the main roof are completely invisible:
The array on the garage is pitched at 18° whereas the array on the main roof is completely flat. Both arrays feed the same inverter which had only one MPPT channel - meaning that this system was never able to function at maximum efficiency. Not a good design.
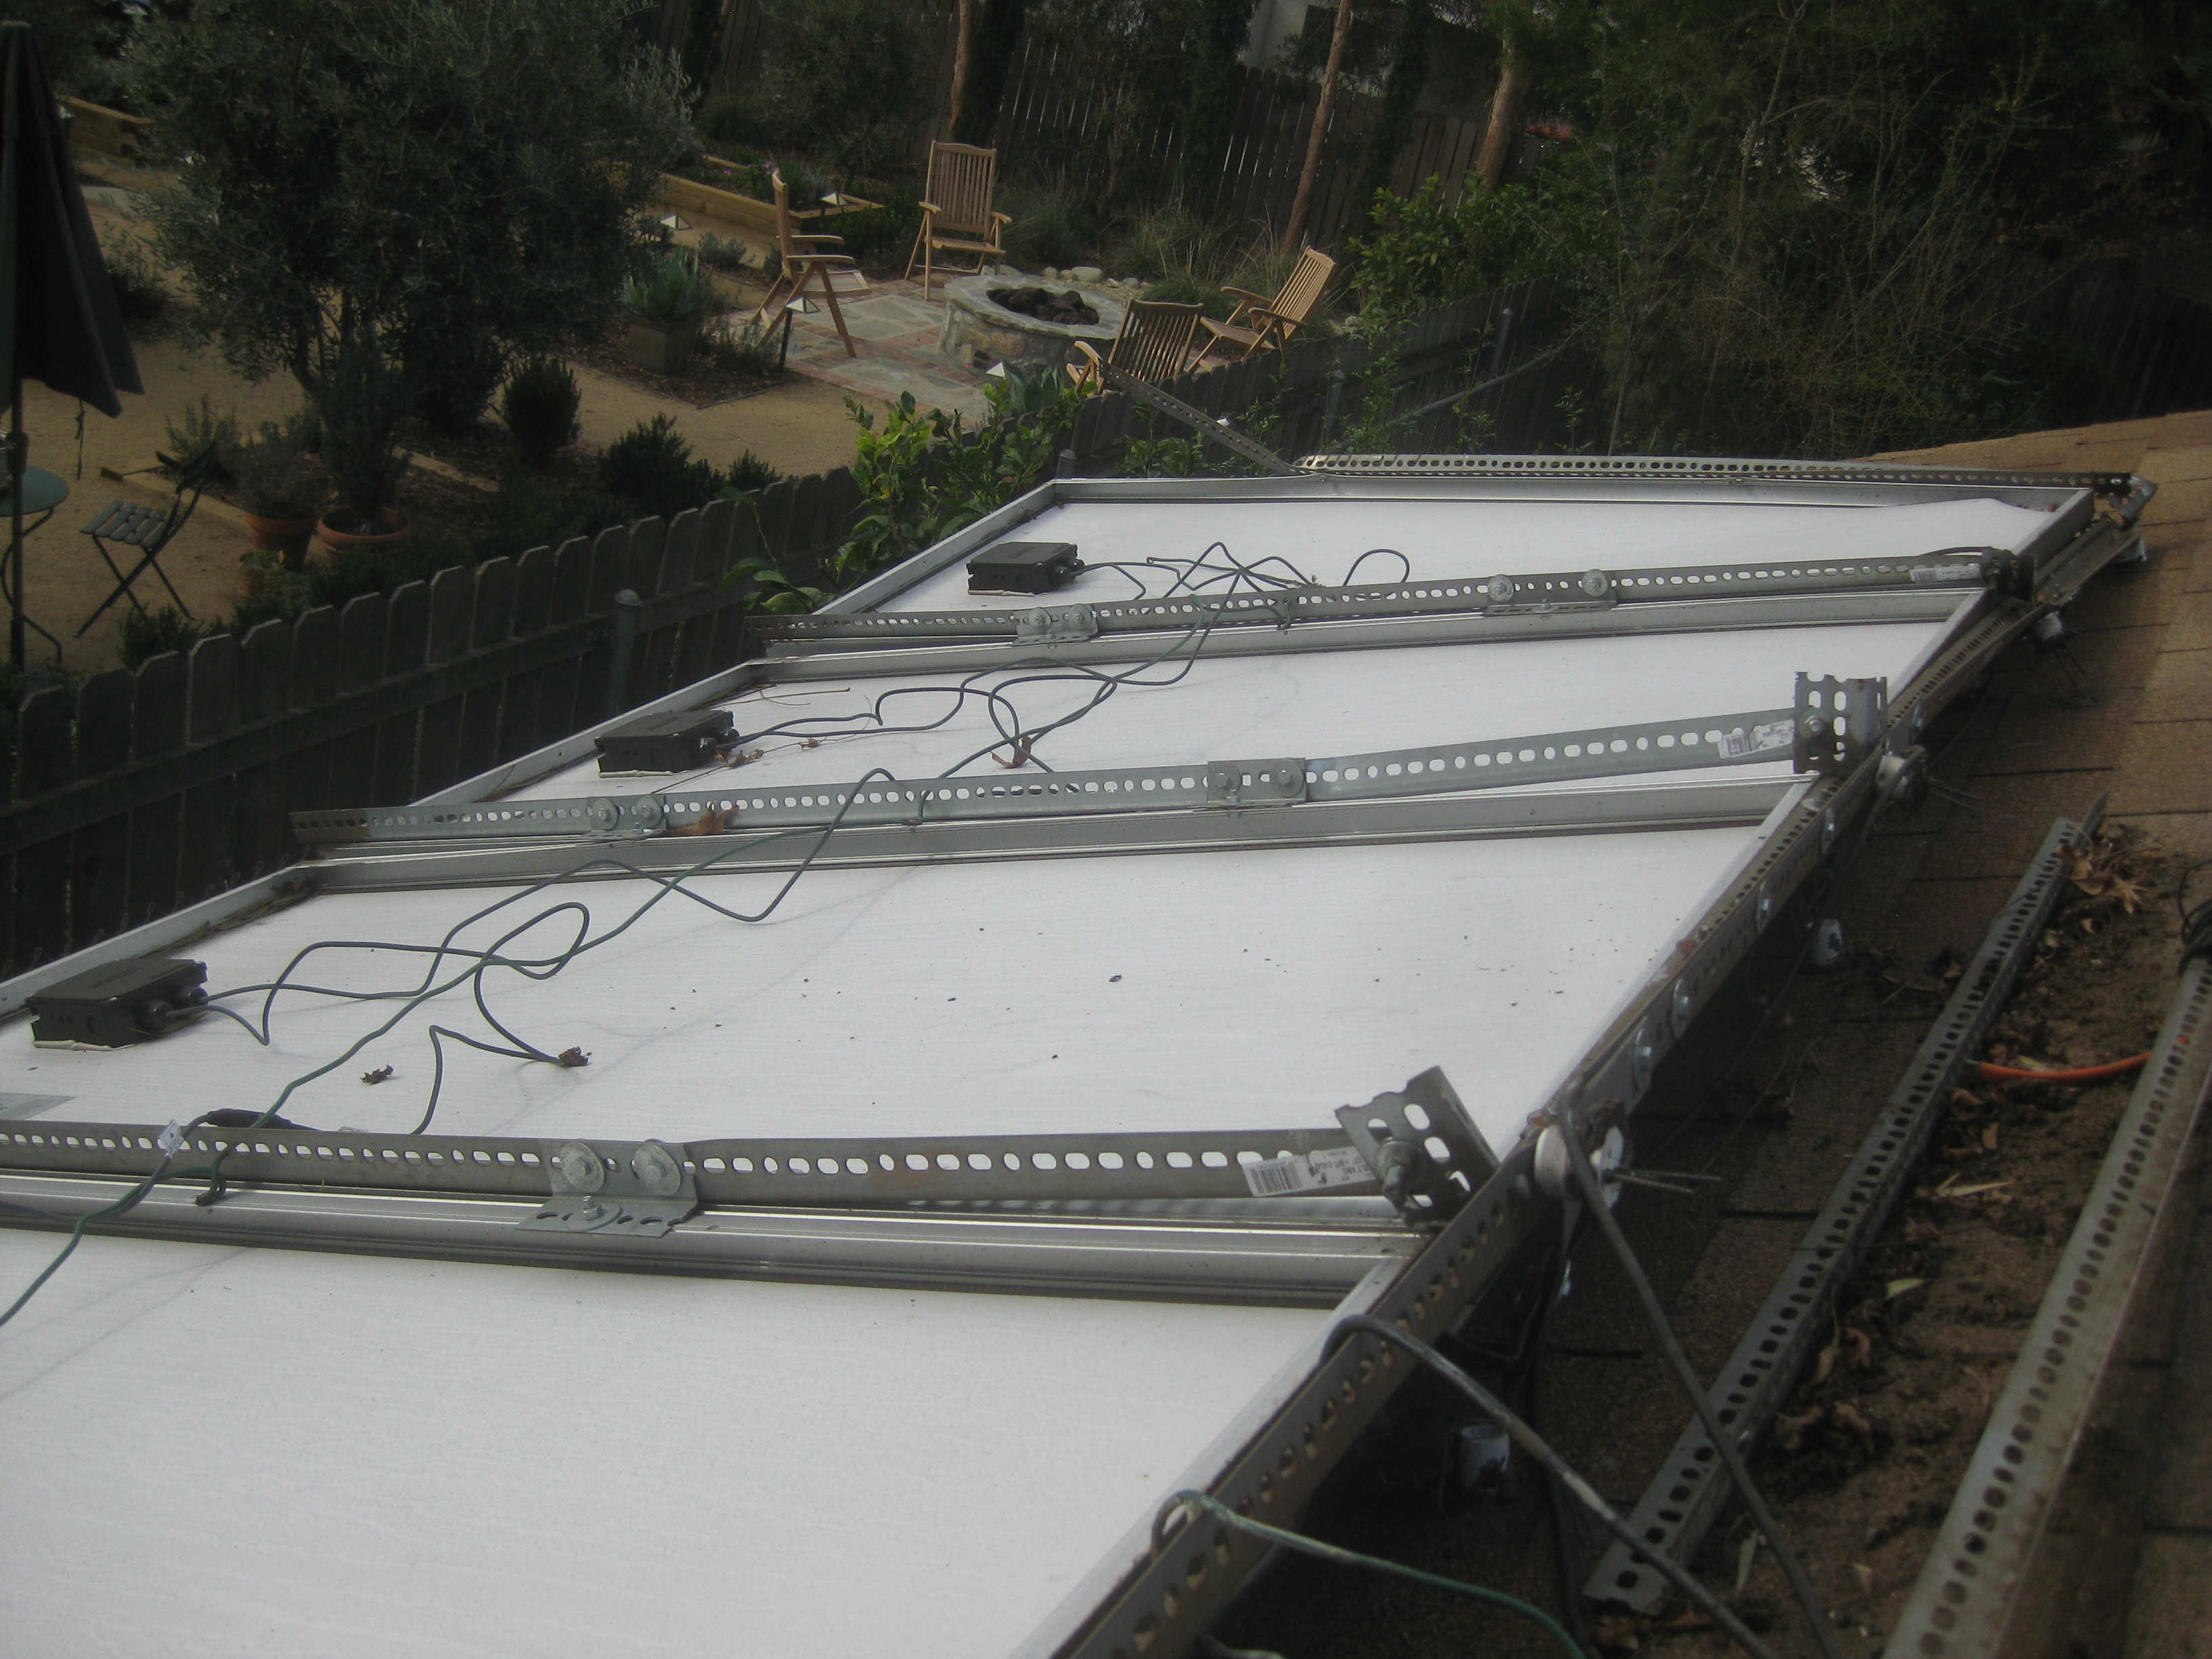
Now factor in the force of once-in-a-decade winds and life takes a definite turn for the worse. The new homeowner called us to come out and assess the damage. Here’s how the array on the garage appeared when we arrived:
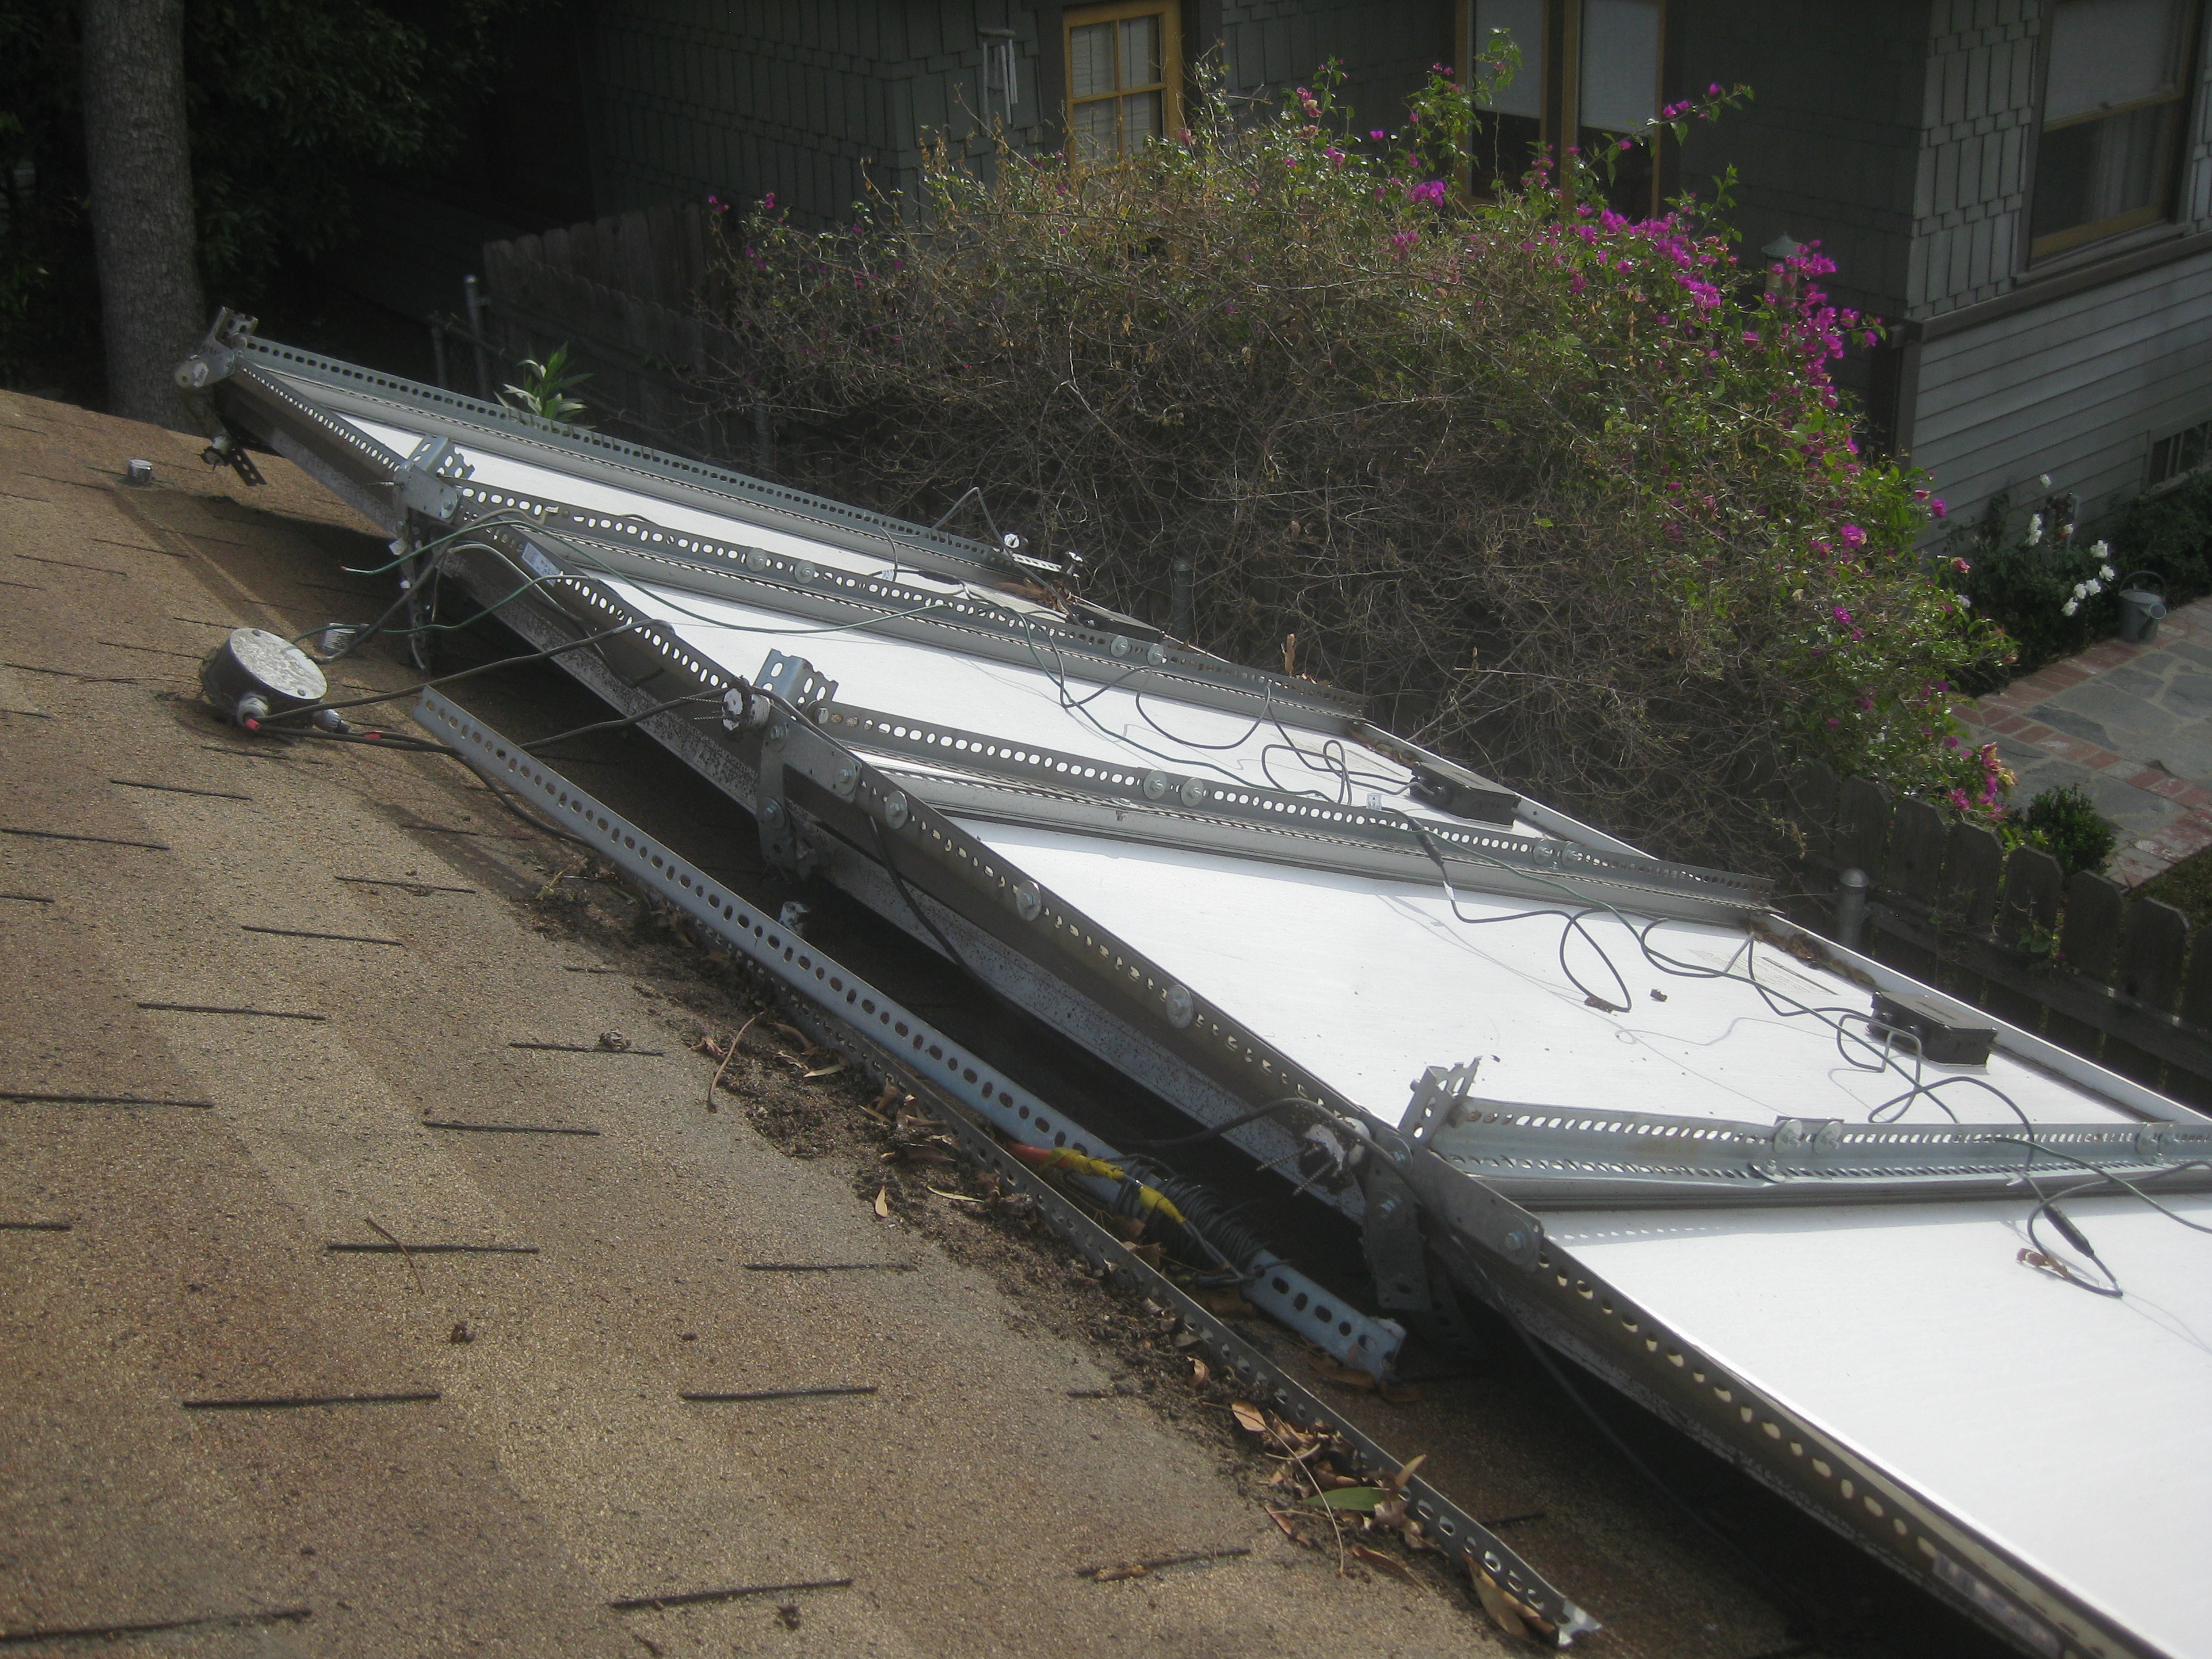
It doesn’t look any better in the other direction:
What happened here?
This array was attached to the roof using angle-iron from the local hardware store and simple wood screws, not lag bolts, to keep that hardware in place. Here’s a close-up showing this homebrew attachment “system":
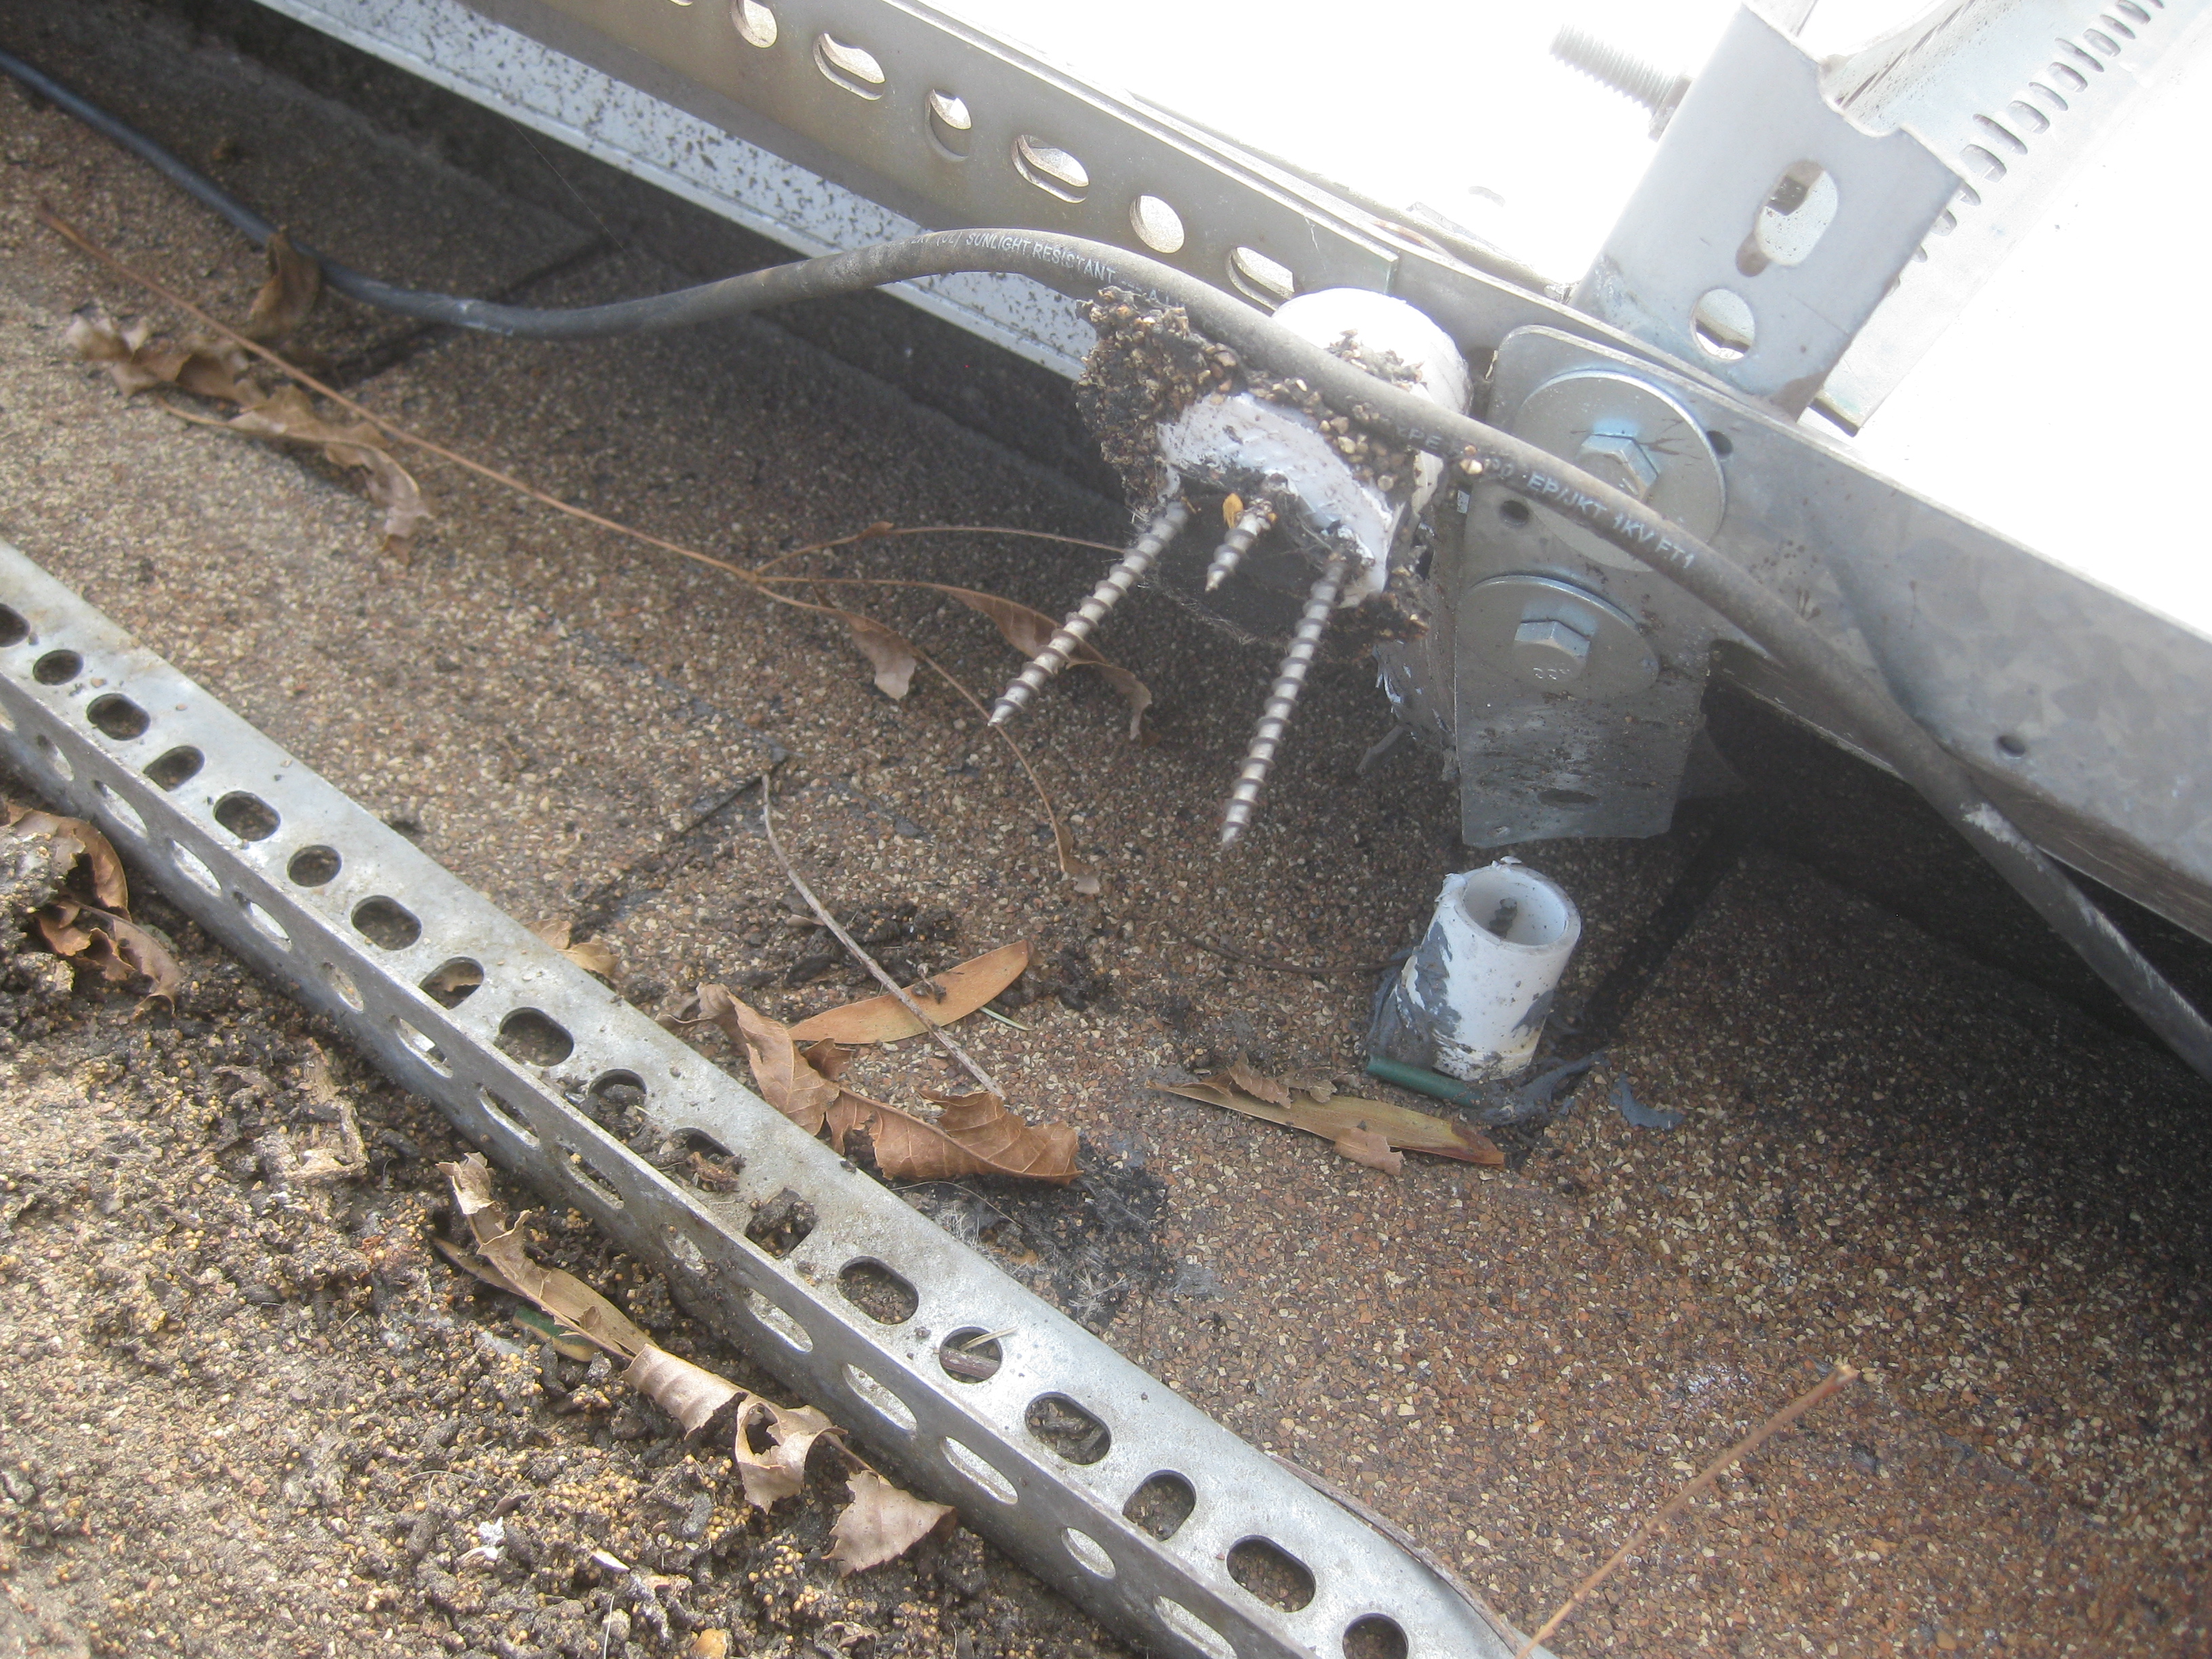
Those simple wood screws are a poor substitute for proper lag bolts but the previous homeowner didn’t even give his system a fighting chance as he ignored the rafters altogether (even though they were clearly visible) and simple screwed his gear into the plywood under the shingles. The result was as predictable as it was unfortunate:

Moral of the story? The cost of adding solar professionally continues to drop, whereas the cost of doing it wrong is as steep as it ever was.
It was only good luck that prevented these panels from flying into the neighbor’s back yard. If the wind had come during the day when the panels were generating power (instead of the middle of the night) the possibility of arcing and fire could have made things much worse.
So please, if you are thinking of adding solar as a DIY project this year, think again and call a pro.
12/06/11
Categories: All About Solar Power, PWP Rebates, PWP, Non-profit solar, Westridge PAC Project
Westridge Chooses Run on Sun for 54kW Solar Project
We are very pleased to report that one of the premier schools in Pasadena - or pretty much anywhere for that matter - the Westridge School for Girls has just selected Run on Sun to design and install a 54 kW solar power system on the Fran Norris Scoble Performing Arts Center.
 Come the Spring, Solar Panels will bloom here!
It is very gratifying to have been chosen over some tough competition for this project, particularly given the School’s well-established commitment to sustainability. Indeed, just last year Westridge dedicated a new science building which has received the coveted, but very rare, LEED Platinum designation. Now as part of Westridge’s plan to “green” all of the campus, the 54 kW solar power system will be another dramatic step in that direction.
Even better, since the project will use Enphase micro-inverters, the students from grades 4-12 will be able to study the performance of the system right down to the individual panel level. We look forward to working with the Westridge faculty and administration as they teach their students about the difference that solar power can make in their lives.
At Run on Sun we have a special place in our hearts for working with non-profits and we would love to help your non-profit add solar too!
08/30/11
Categories: All About Solar Power, Solar Economics, SCE, Commercial Solar, Residential Solar, 2011
The State of Solar California - Part 2: Who's Hot and Who's Not?
Yesterday we wrote about our most recent foray into the California Solar Initiative (CSI) data and how that data revealed trends regarding the costs of solar in SCE’s service area during the first half of 2011. We continue today with a look into the equipment that was specified for these projects and explore who’s hot and who’s not.
CSI Data Generally and Equipment Specifically
As a reminder, our data set for this analysis consists of an extract from the CSI Working Data from 8-24-2011 that includes data for SCE installs where major status activity took place during the first half of 2011. That data set consists of a total of 6,306 projects of which 698 are “delisted” (meaning the project’s rebate reservation has been cancelled for some reason), 3,131 are “installed” (completed or in some stage of rebate payment) and 2,477 are “pending” (in some stage of the process from initial rebate application filed but no rebate claim yet filed). For today’s analysis, we will exclude the “delisted” projects from our data, leaving a total of 5,608 projects to analyze.
CSI tracks data about equipment used on projects in great detail. In particular, for every project, CSI allows for up to seven different panel manufacturers and ten different inverter manufacturers! So how many of our projects use multiple panels or inverters by different manufacturers? We would expect not many, and the data supports that surmise. Only 11 projects reflect two different solar panel manufacturers on the same project and in most of those cases the installer has substituted one solar panel for the one originally designated. (Indeed, one project reflects four different panels being identified to CSI for the same project, finally settling on what appears to be two 180 Watt panels plus six 175 Watt panels feeding a single string inverter - curious design, that!) Similarly for inverters, only 24 projects have two different inverter manufacturers specified and no project reflects more than two. Given that, our analysis will only look at the first specified panel and inverter manufacturer.
Solar Panel Trends
So what is happening with solar panels?
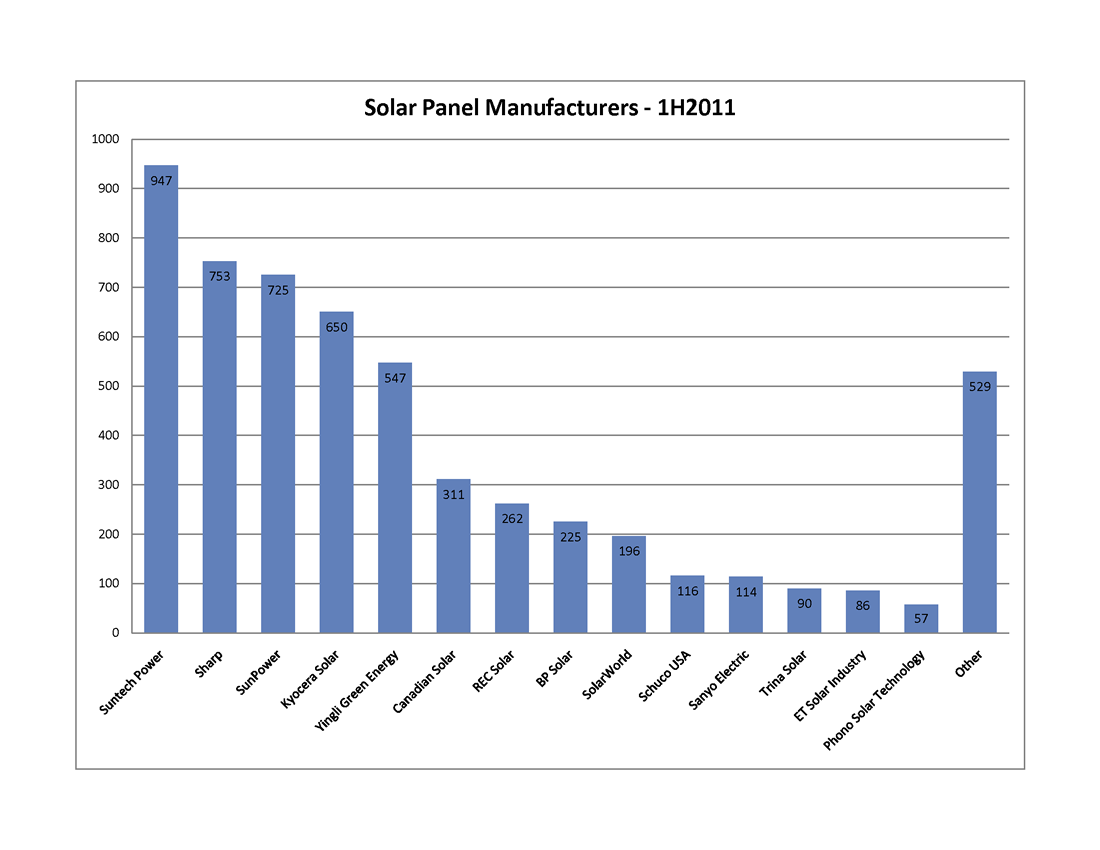 Overall, there are 85 different panel manufacturers included in the data; however, most of them account for very few projects. If we apply a reasonable filter to this data and only look at solar panels that appear in 50 or more projects, the number of represented manufacturers drops from 85 to 14, and the total number of represented projects falls from 5,608 to 5,079. In other words, those fourteen manufacturers account for 90.6% of all of our projects, as demonstrated in this first graph. In fact, the distribution is even tighter with only five manufacturers exceeding 10% of the total: Suntech Power (18.7%), Sharp (14.8%), SunPower (14.3%), Kyocera (12.8%) and Yingli Green Energy (10.8%).
Solar Inverter Trends
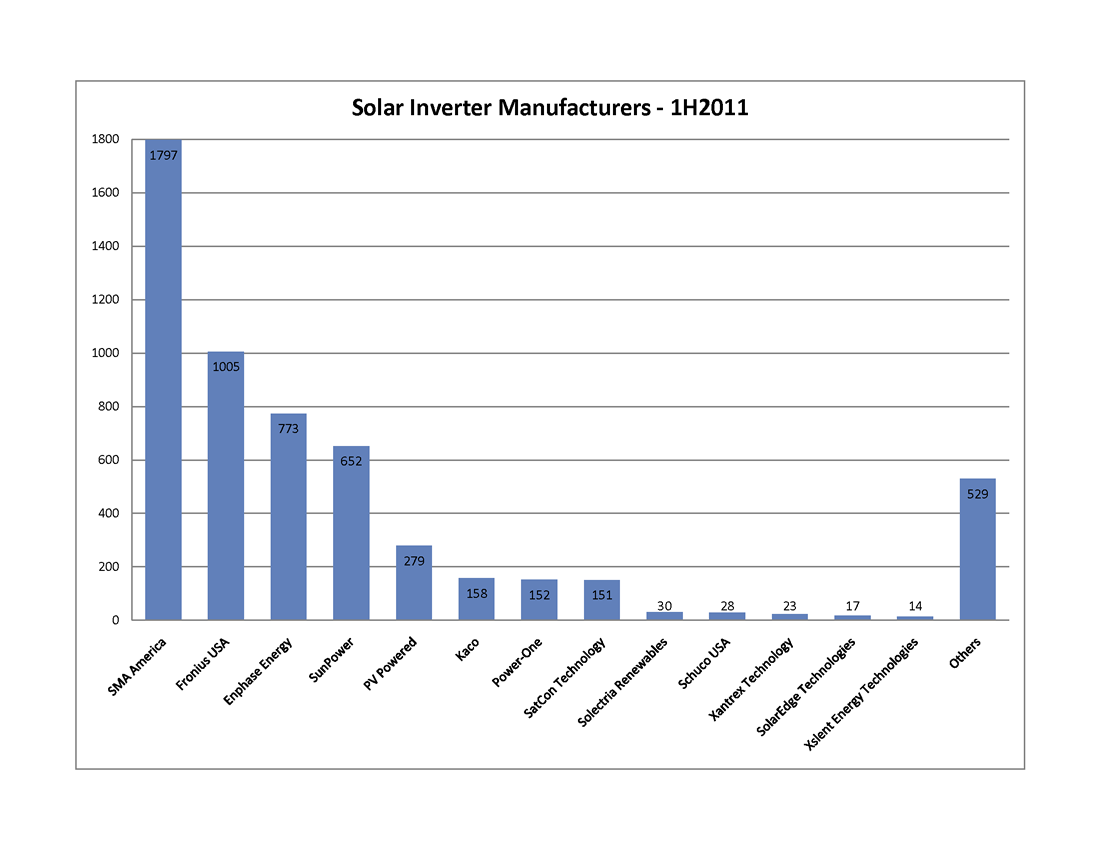
There are twenty-three different inverter manufacturers represented in the CSI data, reflecting the greater complexity of inverters and the more rigorous path required to bring an inverter to market in the U.S. Filtering for manufacturers represented by ten or more systems cuts the list from 23 down to just 13.
SMA America is the runaway winner in this competition. Under their own label, they account for 35.4% of all of these projects. Moreover, the majority, if not all, of the “SunPower” inverters are actually re-branded SMA inverters. When the SunPower inverters are added in, SMA accounts for a whopping 48.2%. That leaves only six other manufacturers to exceed even 1% of the total: Fronius USA (19.8%), Enphase Energy (15.2%), PV Powered (5.5%), Kaco New Energy (3.1%), Power-One (3%) and SatCon Technology (3%).
Two things of interest in those last numbers - the inroads of relative newcomer Enphase Energy (which was only founded in 2006), and the inclusion of SatCon, since alone among that list, it only sells central inverters for the commercial market (where it is dominant).
Popular Pairings
That is how the different manufacturers stack up head-to-head, but what about combinations? Are there pairings of panels and inverters that are most commonly preferred? The data reveals five combinations that account for more than 5% of the total: Suntech panels with SMA inverters (13.5%); SunPower panels with “SunPower” (i.e., SMA) inverters (12.4%); Sharp panels with Enphase micro-inverters (10.3%); Yingli panels with Fronius inverters (8.2%); and Kyocera panels with Fronius inverters (8.2%).
Winners and Losers
While certain pairings are popular - are they cost-effective and how well do they perform together? We decided to look at system combinations from an average $/Watt perspective and from an average CEC efficiency perspective to see what jumps out of the data.
Here’s the first thing that struck us - picking a system with lower-tier panels does not guarantee a lower installation cost. In fact, many of the bottom-tier panels (none of which made the cut in our discussion of panel manufacturers above) had install costs well above our overall average for the data set ($6.37/Watt). For example, we found a handful of systems using solar panels from such luminaries as Apollo Solar Energy, SET-Solar, and REC ScanModule where the average installation cost was more than $10/Watt!
Who was on the very low end of the install cost curve? Gloria Solar, Suniva, Kaneka, Silray and Solaria each had a handful of installations that were below $4.50/Watt.
More significantly, how did our most popular pairings perform? Here’s the data:
| Combination | Average Cost $/W |
| Suntech & SMA | $5.01 |
| SunPower & SunPower | $8.49 |
| Sharp & Enphase | $11.62 |
| Yingli & Fronius | $9.58 |
| Kyocera & Fronius | $9.79 |
What is up with the Sharp & Enphase combination? While Enphase installations are known to cost a bit more than a comparable string inverter installation (confirmed by our own experience), they certainly don’t cost $5/Watt more! Rather, it turns out that the overall average for all Sharp-based systems is $8.53/Watt (nearly $2.00/Watt above the average) with prices ranging from a low of $6.17/Watt (when paired with a Solectria inverter) to a breath-taking high of - are you sitting down? - $19.30/Watt when paired with a Sharp inverter. So who installed that system, you ask? You’ll learn all about it (or at least all that we can tease out of the data) later in this series.
Shifting our attention to efficiency, thin-film module maker First Solar gets the highest overall ranking, 91.7%, thanks to its extremely high STC to PTC ratio. On the more embarrassing end of the scale, Sunlan solar brings up the rear, averaging only 80.7%. From our list of the most popular solar panels, Sanyo (long a Run on Sun favorite) does the best, averaging 89.3% across a variety of inverter combinations. The rest of the top five are: Canadian Solar (87.6%), SunPower (87.5%), Suntech (87.2%), and Schuco (87.0%). The bottom-five of our best selling panels? That dubious honor belongs to: Sharp (86.0%), BP Solar (85.8%), ET Solar Industry (85.6%), Trina Solar (85.5%), and REC Solar (85.1%).
As for our five most popular pairings, here is the data:
| Combination | Average System Efficiency |
| Suntech & SMA | 87.2% |
| SunPower & SunPower | 87.1% |
| Sharp & Enphase | 85.2% |
| Yingli & Fronius | 85.6% |
| Kyocera & Fronius | 86.0% |
That is a pretty tight grouping, with a total range of just 2%. To break out of that mold with a conventional panel/inverter pairing, the Sanyo & SMA combination is your best bet, weighing in at 89.5%.
Who Uses What?
Finally, we decided to see what equipment combinations are preferred by the biggest installers in the market. The following table lists the top-five installers and reports the number of projects in the data, their most frequently chosen solar panel (and % of times used) and their most frequently chosen inverter (and % of times used).
| Name | # of Projects | Panel Mfr (%) | Inverter Mfr (%) |
| Solar City | 910 | Yingli (47.8%) | Fronius (95.5%) |
| Verengo | 688 | Suntech (91.7%) | SMA (81.7%) |
| Galkos Construction | 401 | Sharp (98.5%) | Enphase (99.0%) |
| REC Solar | 207 | Kyocera (42.5%) | SMA (75.4%) |
| Real Goods Solar | 165 | Kyocera (54.6%) | SMA (65.5%) |
Collectively, these 5 installation companies accounted for 42.8% of the projects in the CSI data. Certainly companies this large must have some real clout when it comes to negotiating prices, thereby allowing them to pass along those savings to their many customers.
Or do they?
Find out in our next installment!
08/29/11
Categories: All About Solar Power, Solar Economics, SCE/CSI Rebates, PWP, SCE, LADWP, Commercial Solar, Residential Solar, 2011
The State of Solar California - What Does the CSI Data Reveal?
The California Solar Initiative (CSI) is responsible for overseeing solar rebates for California’s three Investor Owned Utilities (IOUs): PG&E, SCE and SDG&E, and in that role the CSI program collects some very interesting data. As we have in the past, we decided to dip into the data from the first half of this year to gain some insights into the State of Solar in California. Over the next several days we will be reporting on what we have learned - and there are some very surprising things in here to be sure!
Overview & Methodology
A word first about how we processed the CSI data. We downloaded the most recent active data set as of this writing (the August 24, 2011 data set to be precise) and parsed it into Excel. Since we were only concerned about systems in our service area, we excerpted out just the data from SCE. To narrow our focus more, we wanted to only look at applications that had significant status during the first half of this year. The CSI data has a host of date fields - we took the latest of the fields ranging from First Reservation Date to First Completed Date as our Status Date and excerpted those that fell between 1/1/2011 and 6/30/2011 - a total of 6,306 data points.
That’s a fair amount of data but it necessarily omits any data at all from the municipal utilities such as Pasadena Water & Power (where we do much of our work) or LADWP. Unfortunately, none of the munis make their program data generally available - which is particularly odd given that the local residents actually own those utilities (and thus, their data) - but that is a topic for another day.
Finally, for the purpose of these posts, all system sizes are reported in CSI Rating AC Watts (to account for differences in equipment choice and system design) as opposed to DC (or nameplate) Watts.
What can we say about those 6,306 projects? Collectively they account for 164.7 MW of new solar power at a total installed cost of just over $1 billion - with incentive amounts totaling $219 million - roughly 21% of the installed cost. Unfortunately, not all of those are built - or even ever will be. Fully 11% (698) of those projects have the status ‘Delisted’ - meaning that they have been cancelled for one reason or another. Those delisted projects account for 37.8 MW of potential solar power that presumably will never see the sun. (Do some installation companies have a significantly higher rate of “delisted” systems? We will answer that question in a subsequent post - stay tuned!)
The remaining 5,608 are split between “Installed” and “Pending” with 55.8% (3,131) installed and 44.2% (2,477) pending. Breaking that down a little more, the installed projects account for 33.8 MW worth $240.1 million with incentive amounts totaling $57.1 million. In contrast, the pending projects account for almost three times as much capacity at 93 MW worth $575.8 million with incentive amounts totaling $120.6 million. (That is, nearly three times the to-be-installed solar cpacity for roughly twice the rebate dollars.) On average, installed projects cost $7.09/Watt whereas pending projects cost $6.19/Watt - a positive trend for consumers since it shows the cost of solar power systems declining over time.
Does Bigger = Lower Cost?
Finally, for today, let’s examine whether the data supports the notion of solar economy of scale - that is, as system size increases does the installed cost/Watt decline? To get a handle on that, we took two different cuts through our data set - “small” installed or pending systems <10 kW, and “large” systems ranging between 10 kW and 1MW.
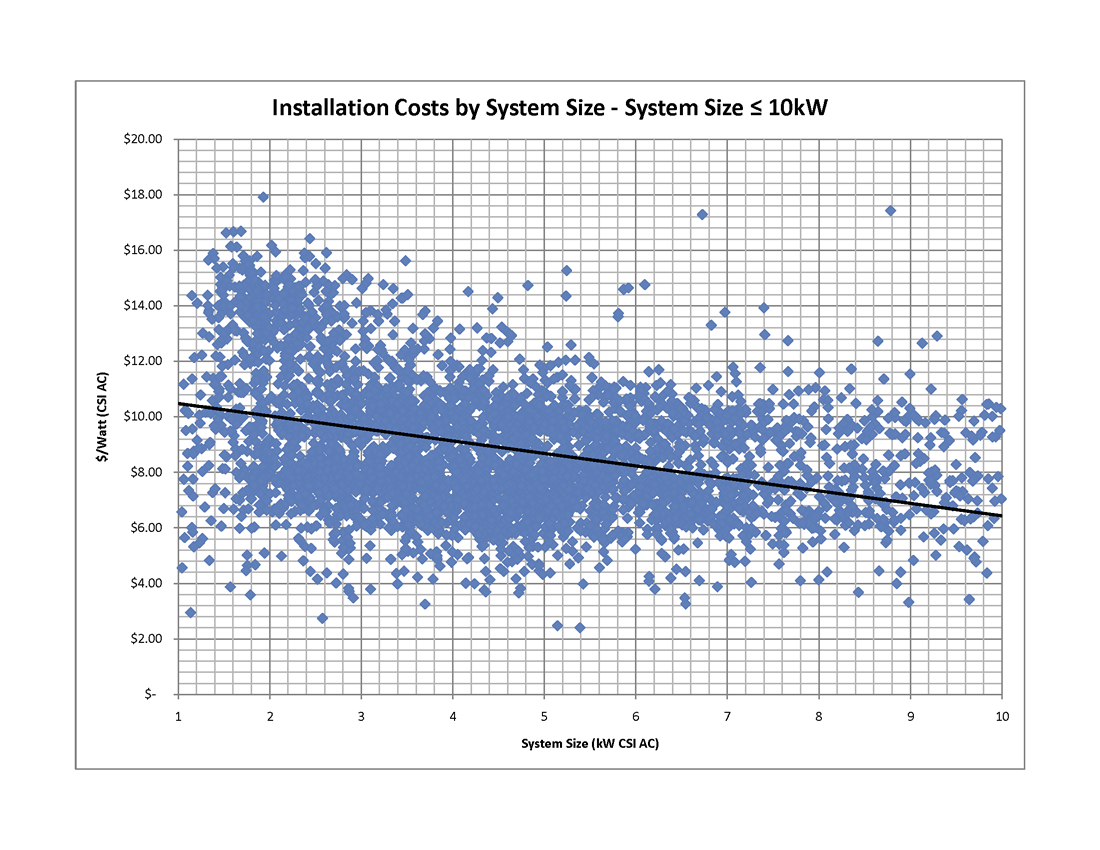 First, here’s the graph for the “small” systems (consisting of 4,992 installed or pending systems - click on the graph to view full size). As the trend line makes clear, larger systems really do drive down costs - decreasing from over $10/Watt at the small end of the range to just above $6/Watt for systems around 10 kW.
Another interesting observation from this graph are the outliers - with some data points below $3.00/Watt (mostly from self-installed system) all the way up to nearly $18/Watt!!! (We will have way more to say about those data points - and who is responsible for them - later in this series.)
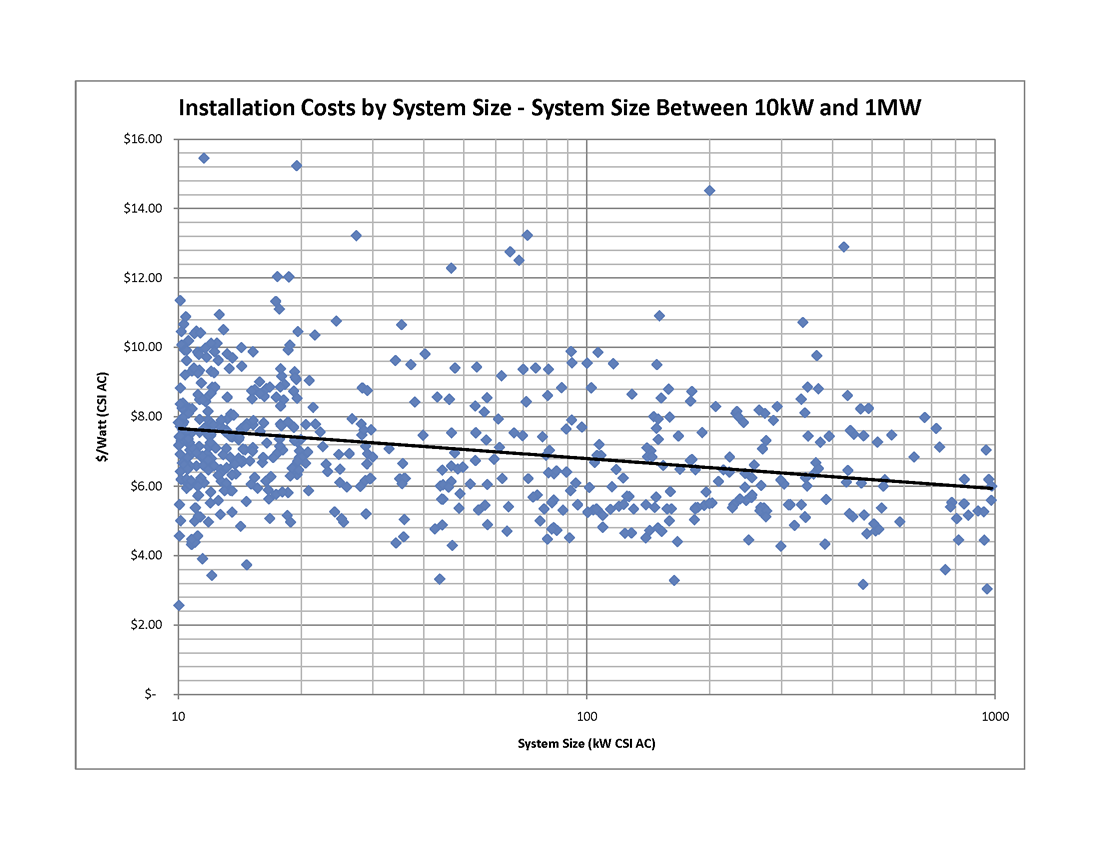
If we now look at larger systems - those between 10 kW and 1MW - our data set has 587 such systems and again, the trend line shows the decline in system costs as system size increases. (Note, because there is such a huge range in system sizes on this graph, we plotted the system size on a log scale.) Some of these outliers are also pretty curious - a 200 kW system coming in at over $14/Watt?
Of course, this data is showing what happens when an individual project gets larger and there the trend is clear. One might well ask, does the same trend apply to larger installation companies? In other words, as a company has more and more installs, does that economy of scale translate into lower costs for the end consumer? That’s a very interesting question and the answer - coming in our next post - just might surprise, or maybe even disturb you.
If there are some other cuts of this data that you would like to see, just let us know in the comments. Trust me, we are just getting started!