Categories: "Solar Rebates"
08/24/12
Categories: All About Solar Power, Solar Economics, SCE/CSI Rebates, SCE, 2012
State of SoCal Solar 2012 - Part 1: Overview
UPDATE - Read Part 2 of our series here: Who’s Hot and Who’s Not?
One year ago we wrote a three-part series analyzing six months worth of CSI data that turned out to be our most read blog posts ever. So back by popular demand, here is our analysis of the first half of 2012 CSI data in the SCE service area.
Methodology
First a brief review of our methodology. We started by downloading the Working CSI data set dated August 22, 2012. (Here’s a link to the CSI Working Data download page, and here’s a link to the data set (8MB zip file) that we used for our analysis.) As we did a year ago, we limited our analysis to just the data from the SCE service area. To limit our time period to the first half of 2012 (equivalent of what we did last year), we took the latest of a series of milestone dates in the CSI data (from First Reservation Date to First Completed Date) and used that as our Status Date and limited that date to values from 1/1/2012 to 6/30/2012. Collectively, that accounted for 9,669 projects, an increase of 53% over the same period last year!
So that we can compare apples to apples, our analysis uses CSI AC Watts as the measure of system size (except where noted) instead of the more commonly reported DC or Nameplate Watts. Why did we do that? Well, not all 5kW Nameplate Watts systems are the same. Some systems use less efficient inverters whereas others have panels that have very poor temperature performance (as indicated by their PTC rating), and some sites are poorly oriented or have substantial shading. CSI AC Watts values take all of those factors into consideration - thereby giving a truer measure of the system’s actual performance.
Overview
Apart from the dramatic jump in the number of projects over the same period last year, how does the overall data for the first half of 2012 compare to that data from last year? Here’s what we found:

Even though the number of projects increased dramatically from the same time period last year, the potential installed capacity of the projects declined significantly. This may well reflect the expiration of the federal 1603 Treasury Grant program as it became harder to finance new commercial projects after the first of the year. Here’s how the averages changed from 2011 to 2012:
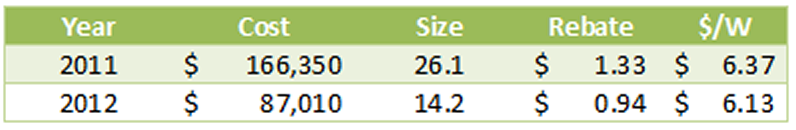
The average system size in the 2012 data dropped 46% from the same period in 2011. Likewise, rebate expenditures per Watt fell from $1.33 to $0.94, or 29%. At the same time, the system cost per Watt also declined, but far less dramatically, from $6.37 to $6.13/Watt. We will have more to say about system costs later.
Altogether, the data reflects a total of 519 different solar contractors, of which 213 (41%) were responsible for only one project.
Delisted by Design?
One intriguing item we noted last year was the significant number of projects - a full 11% - that were categorized as “delisted” meaning that they had been cancelled for one reason or another. How did that number fare in our new data? It dropped significantly down to just 4.2% of all projects, 6.3% of the potential installed capacity.
Of course, projects can be cancelled for a host of reasons. Nevertheless, we decided to see if there were any companies that jumped out as having an unusually high rate of delisted projects. We listed all of the companies that had any projects flagged as delisted (a total of 113 different companies) and compared that to their total number of projects. We extracted those companies that had ten or more delisted projects and rank ordered them by the percentage of all projects that were delisted.
Here’s what we found:
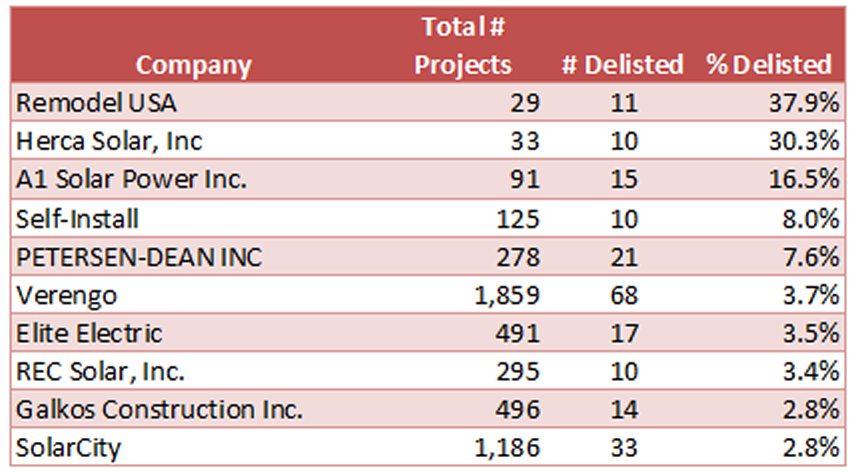
Holy smokes, what is going on here? Either Remodel USA, Herca Solar and A1 Solar Power are really unlucky, or something about how they create projects would seem to be problematic. We will have more to say on this point in a subsequent post in this series.
Oh and a note to Do-It-Yourself’ers - you have a one in twelve chance of not completing your solar project. Maybe solar really is something better left to the pros!
Is Bigger Still Better? (Or at least Cheaper?)
We closed Part 1 last year by looking at how the size of a system drives down the cost, and we wondered if the same would hold true this year? To find out, we excluded delisted projects from our data and divided the remaining projects based on system size with one category being systems below 10kW and the other being between 10kW and 1MW. (Strangely, we had to exclude some real outliers from our “small” system category - can you believe it, we found systems priced at over $30/Watt? Again, much more to say about that in a subsequent post.)
Here’s our results for the small system category:
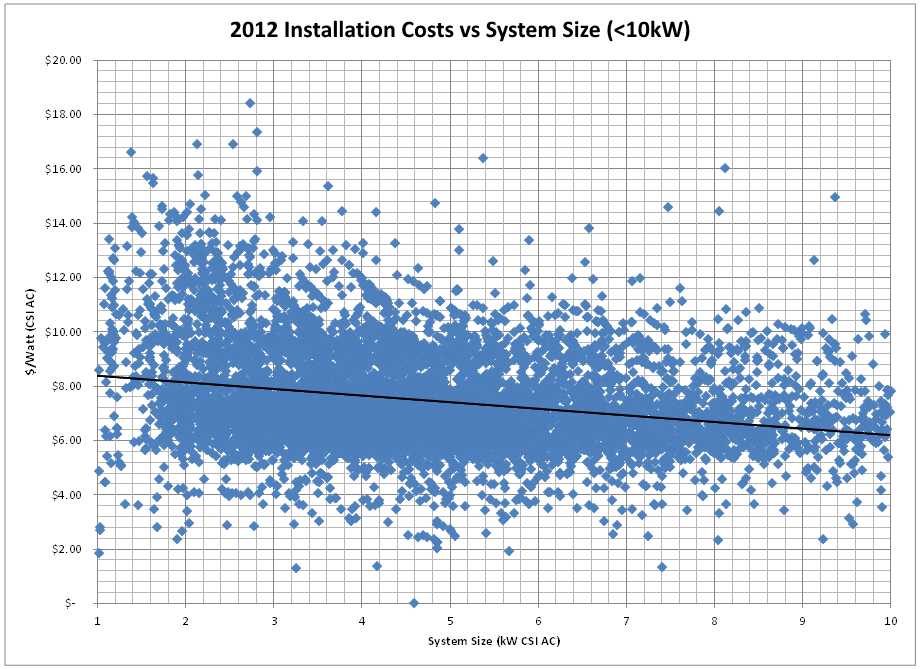 Our trend is still downward as system size gets larger, but the slope is not nearly as steep as it was in our corresponding graph last year. Costs start at $8.59/Watt for the smallest systems and decline to an average of $6.41/Watt for systems just under 10kW. That’s a rate of decline of $0.24/Watt per kilowatt of system size increase, in constrast to a rate of decline of $0.34 last year. Certainly as component costs decrease, their related economies of scale would likely flatten out and that is what this data appears to be showing.
Finally, then, let’s turn to the “big” systems - those between 10kW and 1MW - how did our system costs do in that group?
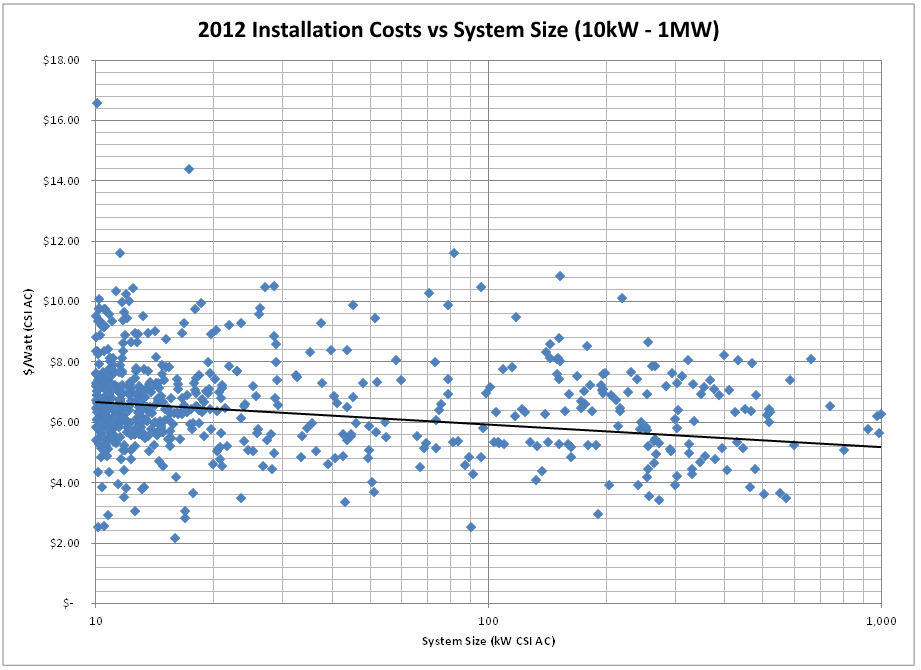
Again, another outlier as our highest system cost here is higher than it was a year ago - $16.50 vs $15.50/Watt. Overall, we continue to see the downward trend as system size increases, but again, not as pronounced as it was a year ago. This year, we see the average cost of a 100 kW system coming in just below $6/Watt whereas a year ago the 100 kW benchmark was closer to $6.80/Watt. So our trend line is lower, but flatter than a year ago.
Moreover, we see far few systems in the 500kW and up category compared to last year. Specifically, this year we have only 24 projects that crossed that threshold (10.98 MW total capacity), compared to 32 last year (21.6 MW). Bottom line - projects have gotten smaller and really large projects have dropped off substantially. Without the pull of those larger systems, it is not surprising that we are not seeing the same downward pressure on costs for larger systems.
Preview of Coming Attractions…
That’s enough to get us started. Yet to come: whose equipment is hot and whose is not? Any significant new kids on the block (be they installers or products)? And who are our outliers this year? (Hint - you’ve already seen some of those names!) So stay tuned as we name names and follow the data wherever it may lead!
And of course, if you have thoughts on cuts of the data that you would like to see, please let us know in the comments.
05/04/12
Categories: All About Solar Power, PWP Rebates, PWP, Commercial Solar, Non-profit solar, Westridge PAC Project
Westridge Project Grabs Pasadena Weekly's Green Issue Front Page!
 Readers of this blog will know all about the 52.3kW solar project that Run on Sun just recently completed installing at Pasadena’s renowned Westridge School for Girls. Now that project has become the cover story in the Annual “Green Issue” of Pasadena Weekly.
Titled, “Solar Flair: New solar installation at Westridge School brings environmental lessons to life,” the piece features interviews with Westridge’s Head of School, Elizabeth McGregor, Facilities Manager Brian Williams, and three students who are part of the school’s environmental group known as the Green Guerrillas. The story reveals the school’s deep commitment to sustainability in everything from solar power to drought tolerant plants.
This first of what we hope will be many solar projects at Westridge really highlights the value of these projects for all schools, especially those in the Pasadena Water and Power service territory. Good rebates and a solar company that really understands your goals makes a solar power system installed by Run on Sun a “no-brainer.”
Contact us today and let’s get going with YOUR solar project!
Categories: PWP Rebates, PWP, Commercial Solar, Non-profit solar, Westridge PAC Project
The Permit Process - Installing Solar at Westridge - Part 2
In Part 1 of this series about Installing Solar at Westridge School, we looked at the process of putting our materials together for the rebate application. With the rebate safely reserved, it was time to turn to pulling the permits for the job. A solar project of this size involves two separate permits - building and electrical - but four points of inspection - fire, electrical, building, and utility. We had already provided the utility, PWP, with the materials they needed but now we needed to load up for the permit center.
Assembling the Necessary Materials
The permit process addresses an entirely different need than does the rebate application. The permit process is intended to guarantee that the proposed system, as designed, satifsfies all applicable codes and standards. In theory, once you have successfully pulled the permit, the inspection process should simply be a matter of showing the inspector that you built the system as it was approved when you pulled the permit.
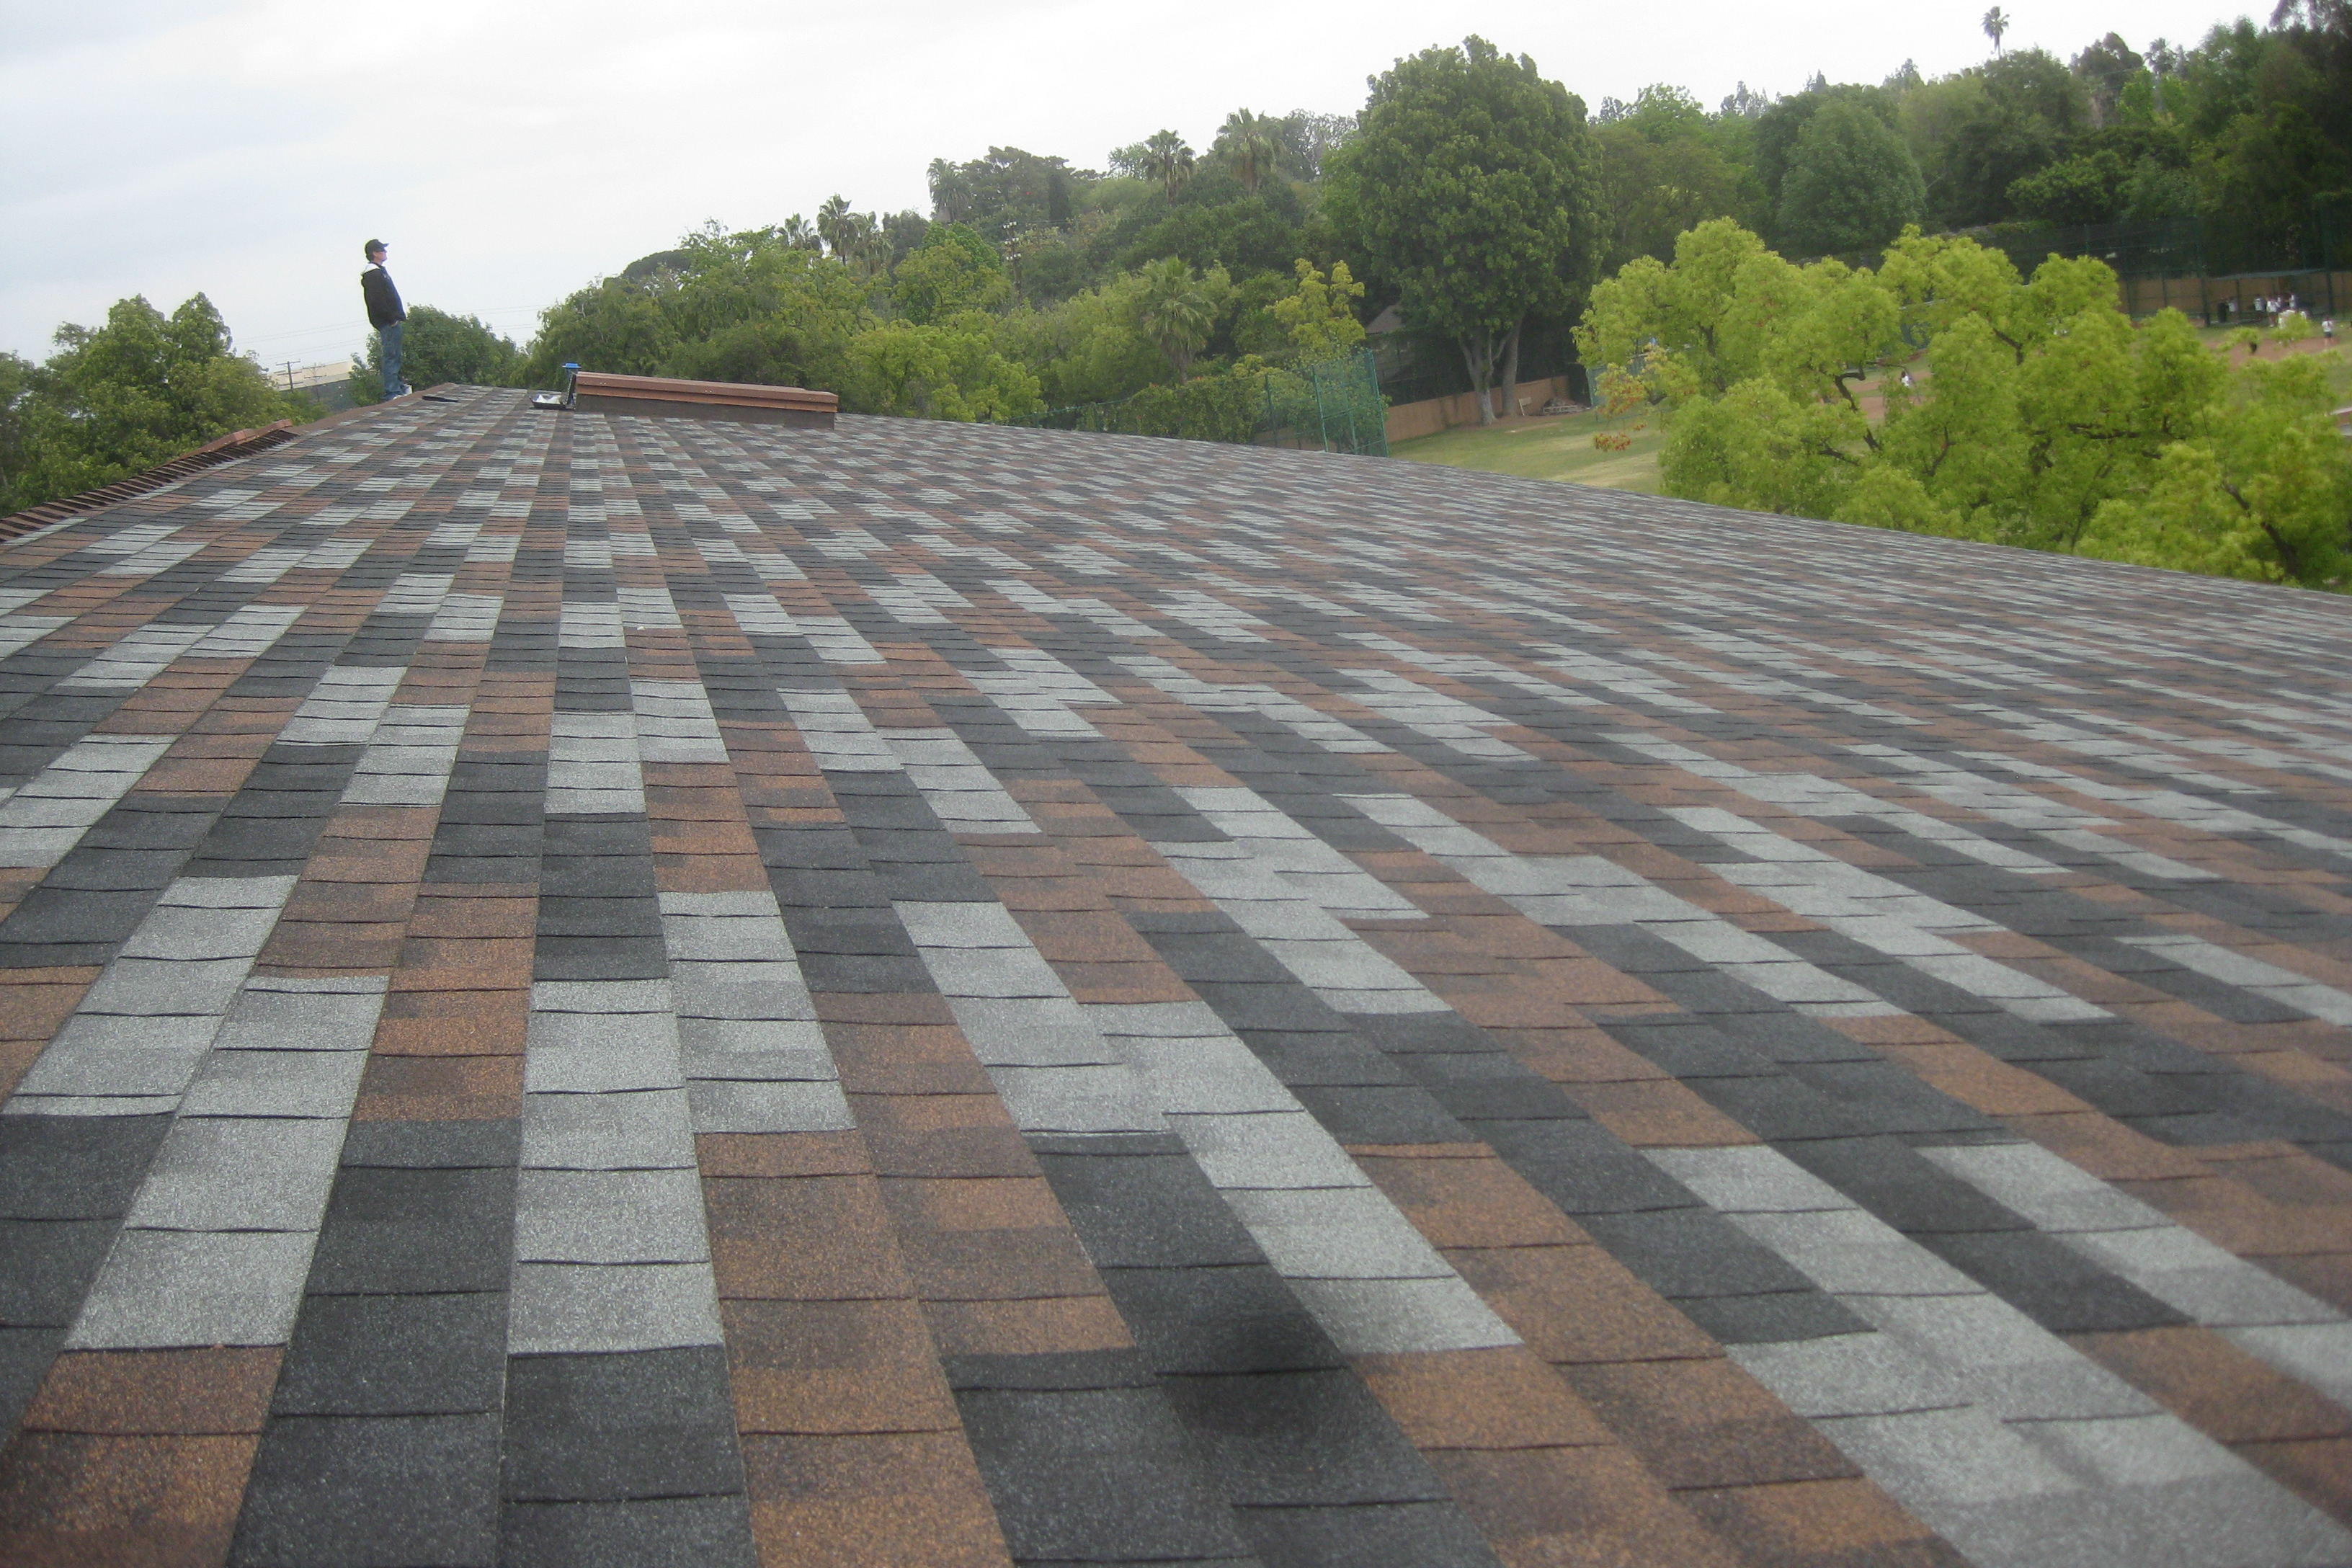 It looks conventional enough!
This project presented one signficant challenge - the actual attachment of the system supports to the roof. While the roof looked conventional enough, that was not a wooden truss underneath those shingles. To the contrary, our roof was built from a 20 gauge “Type B” steel deck with two layers of 5/8″ plywood, followed by 3″ of solid foam insulation, followed by 3/4″ of plywood to which the roofing materials themselves - membrane, felt and shingles - were attached. So the question arose: what would be a sufficient way to attach our standoffs to this roof to provide the requisite resistance to wind loads - the effect of which had recently been demonstrated in Pasadena in such a disastrous fashion?
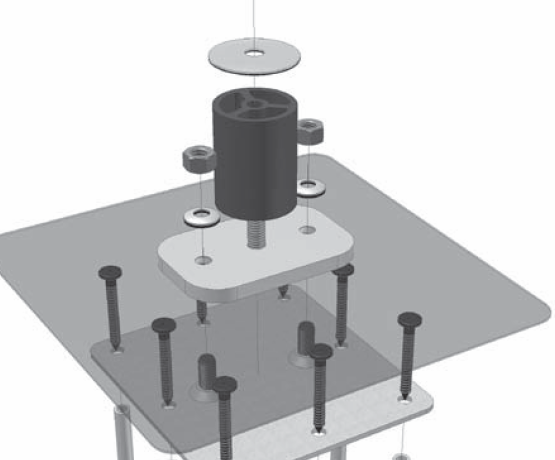 Unirac Fastfoot Attachment
To help answer that question we turned to the structural engineer (SE) who had originally done the load calcuations for our building. Could we use a “FastFoot” and simply put multiple screws into the wooden decking materials? Surely with enough screws - the FastFoot will allow for up to eight - we could reach the required pull-out resistance. Unfortunately, that wouldn’t work since the engineer could not guarantee the manner by which the plywood materials were secured to the underlying steel deck. In other words, while we could be sure that our array would remain attached to the plywood, we couldn’t be sure that the plywood would remain attached to the building! Images of Wizard of Oz roofs flying through the air filled my mind - clearly we would need another way!
The engineer suggested that we could use carriage bolts that ran all the way through the steel roof and were bolted together on the back side. Certainly such an approach would guarantee that our array and the roofing materials stayed connected, and indeed, you would have to separate the steel deck from the steel framework of the building for that method to fail. Unfortunately, that wouldn’t work either since there was no way to access the back side of the roof in order to complete the connection.
“Nine-Inch Nails” Meet 8-Inch Screws!
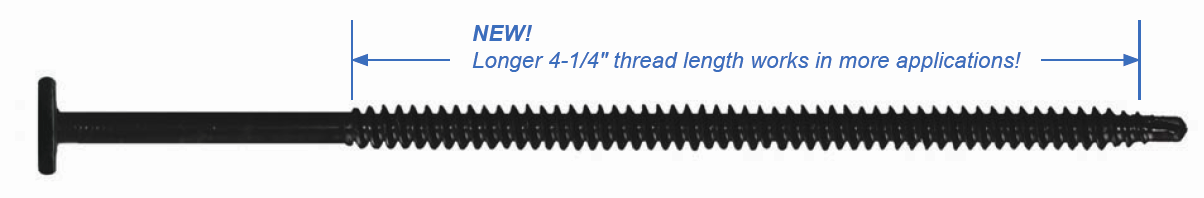
There was one other approach - a company by the name of Triangle Fasteners sells some very strong, very long, self-tapping screws (called “Concealor screws“) that could drill their way into the steel deck and provide us with the required pull-out resistance. The bad news - our distributors only sold screws up to 7″ long - and that would not be long enough to guarantee that our screws made it through the decking. A call to the manufacturer revealed that in fact, they did make 8″ screws, they even made 9″ screws! Excellent! We now had a solution that our SE could bless. It was time to go pull our permits.
Fear and Loathing at the Permit Center
Anyone who has ever pulled a permit knows the combination of emotions that you encounter upon entering the building: fear that something you haven’t considered will suddenly become A Really Big Deal, loathing for the interminable waiting, and of course, the pain of paying for it all. Dentists’ waiting rooms tend to be cheerier places.
Pasadena’s permit center is certainly better than most: it is a comfortable old building across the street from the beautiful City Hall. They have a clever scheduling system that routes you among the different windows: Building and Safety, Zoning, Historical Preservation (very big in Pasadena but not a factor for solar projects), Fire, Permit Processing and, last but certainly not least, the Cashier. A solar project applicant must navigate their paperwork through every one of those windows before exiting with your Grail - a stamped set of plans and a bright Yellow permit folder where inspection sign-offs will be recorded.
First stop - Building and Safety.
Building and Safety
The building and safety folks are responsible for reviewing your plans for conformity with state and local codes and standards - a really important task. First, however, you have to speak with someone who knows what you are showing them and on our first trip to the permit center, no such person could be found! The gentleman behind the B&S desk was very polite, and you could tell that it pained him to inform us that after our thirty minute wait, he couldn’t help us. Moreover, none of the people who “understood solar” were available - we would have to come back tomorrow.
Tomorrow dawned cloudy but we were determined to press forward. This time our 35 minute wait was rewarded with an appearance before someone who was prepared to pass judgment on our plans! We walked him through each of our sixteen 24″ x 36″ pages, explaining as we went exactly what we were doing and where the answers to his questions could be found.
All seemed fine, but then he started throwing us some curves.
Our SE had done his calculations for a basic wind speed of 85 mph - the same wind speed we had always used for load calculations in Pasadena.
“No,” said the man behind the desk, “You have to use 100 mph.”
“Really? Since when?”
“Since the windstorm in Pasadena at the end of November,” we were told. (Never mind that the wind speed never reached 85 mph in Pasadena, let along 100 mph, during that terrible event.)
“Really? Where was that published?”
“It wasn’t,” he conceded, but simply told us that we needed to revise our calculations for 100 mph or he wouldn’t approve them. That meant another iteration with our SE and another trip back to the permit center.
Now the good news here is that we were certain that our system would easily handle 100 mph winds (or 120 mph, for that matter) so this change in policy did not pose a danger to the project going forward. But changing the basic wind speed for an area from 85 to 100 mph is something of a big deal and will add to the expense of many projects that need permitting. Shouldn’t there be a more public process before such a change is implemented?
The other curve sent our way was really just odd.
We did a detailed drawing showing our attachment method as it penetrated the various layers of roofing materials and made contact with the steel deck beneath. We drew that straight up on the page and included multiple elevations in our sixteen pages that showed the pitch of the roof and indicated that the array was installed on top of our attachment method, parallel to the roof.
“Not good enough,” we were told.
“Why? What’s missing?”
“You need to show the attachment at the slope of the roof.”
“Really? We show you the slope of the roof, we gave you the detail of how the attachment connects to the roof and we told you that the array is parallel to the roof. How is that not sufficient?”
“You need to add a drawing that shows the array attachment and which reflects the slope of the roof.”
“Really? So what you want is for me to rotate the image of our attachment 13° to reflect how it will be pitched on the roof?”
“Yes.”
Sigh. Ok, back to the drawing board (or more accurately, the computer screen).
Fortunately, our SE was able to redo his calculations in short order. And not surprisingly, it was also pretty easy to take our attachment image and rotate it. We printed up the revised plans and headed back to the permit center.
Surprise - there was yet another person behind the counter this time. Whereas his predecessor seemed to be actively looking for little things to complain about, this fellow could not have been more helpful. He looked at our revised load calculations - veryifying that they had been done for 100 mph and that the SE had concluded that all was well - and then proceeded to stamp our plans. (I had pointed out our added, rotated drawing, but it was clear that he wasn’t interested in that at all.) After he stamped our plans, he then took them himself to the zoning and historical preservation desks and secured those sign-offs as well! Wow! He saved us an hour of waiting in those queues and he seemed genuinely helpful and concerned. What a pleasant contrast! We were well on our way with just one real substantive hurdle remaining - the Fire department.
Fire
The California State Fire Marshall developed a set of guidelines that provide guidance as to how fire departments should permit and inspect solar installations. The guidelines call for space to be set aside for pathways around the array and for venting of smoke in case of a fire. The guidelines call for different restrictions based on the size and shape of the roof and whether it is a residential or commercial building.
(While the document from the Fire Marshall is labeled “guidelines", most localities seem to treat it as gospel. Even more curious, the guidelines clearly say that they are just that, guidelines that do not have the force of law until a local jurisdiction passes an ordinance adopting the guidelines as regulations. We have yet to see such an ordinance.)
Our building plan included a three-foot set aside around both sides of the array and from the ridge, and was augmented by automatic smoke ventillation devices already built into the roof. But that was not sufficient - the fire official wanted us to provide a four-foot clearance on all three sides. Yet another trip to the computer.
We returned with our revised drawing, showing four feet of clearance as requested. But now there was another concern - the same fire official now wanted us to open a walkway in the middle of the array. (We already had access paths for potential maintenance, but they were not wide enough to be considered a walkway.) No matter that our roof was not at all like the flat roof with parapet shown in the guidelines, we still needed to provide a walkway. There was only one way to do that - take out a column of panels. Together we X-ed out seven panels and thereby created a walkway. The fire official was now satisfied - she signed off on our plans.
Done
And just like that, we were done. Well, not quite - there was still the little matter of paying for all this. Here we made out surprisingly well. Unlike some cities that gouge solar applicants (and you know who you are!), Pasadena’s fees were quite reasonable. Total cost for our now 52.25kW solar project? $732. Sadly, we know of residential projects one tenth that size in other cities where the permit fees have exceeded $1,000! (But that’s a story for another day.)
Altogether, it took us four separate trips to the permit center, three plan revisions, and a little over $900 in expenses to secure our permit.
Now all we needed to do was get the materials to the job site on time, and complete the installation in the two week window that we had to mesh with the School’s schedule. The real work was about to begin…
Categories: PWP Rebates, PWP, Commercial Solar, Non-profit solar, Westridge PAC Project
Installing Solar at Westridge - Part 1
In November of 2011, Run on Sun was hired by Westridge School for Girls to install a 54 kW solar system on the roof of the school’s Fran Norris Scoble Performing Arts Center (the “PAC” as it is known on campus), and that project was just recently completed. This multi-part series will document the process by which we went from a signed contract to a signed-off solar power system. Not surprisingly, there were a few twists and turns along the way that had to be resolved before we could deliver a successful project, and this series will showcase those developments in the following five parts:
Part 1 - The Rebate Application (this post)
Part 2 - The Permit Process
Part 3 - On the Ground
Part 4 - On the Roof
Part 5 - Putting it All Together
The Rebate Application
The rebates being offered from Pasadena Water & Power (PWP) for this non-profit project were scheduled to step-down on December 1, 2011. Indeed, this was a substantial rebate reduction - 26% - such that failure to secure the existing rebate rates would have amounted to a hit of tens of thousands of dollars for our client. And PWP had made it very clear - unless applications were 100% complete and correct, they would be rejected and when resubmitted would be subject to the reduced rebate rates. Clearly the pressure was on to get this right the first time!
The application package consisted of eight parts - most of which were straight-forward, but a couple required substantial work to guarantee that the application as submitted would be acceptable the first time. Here are the parts that went into the rebate application: 1) Signed Rebate Application (PWP’s form, signed by client and Run on Sun under penalty of perjury!); 2) Single Line Diagram for the electrical components of the system (more on this below); 3) Site Plan; 4) CSI Report (as produced by the California Solar Initiative’s rebate calculator); 5) Shading Analysis (i.e., a Solar Pathfinder report to support the shading values used to create the CSI Report); 6) PWP’s Net Metering Agreement (executed by the client); PWP’s Net Metering Surplus Compensation form (for AB 920 compliance); and 8) Installation Contract between the client and Run on Sun. Also, since this was a non-profit client, proof of non-profit status was also required.
Shading Analysis & CSI Report
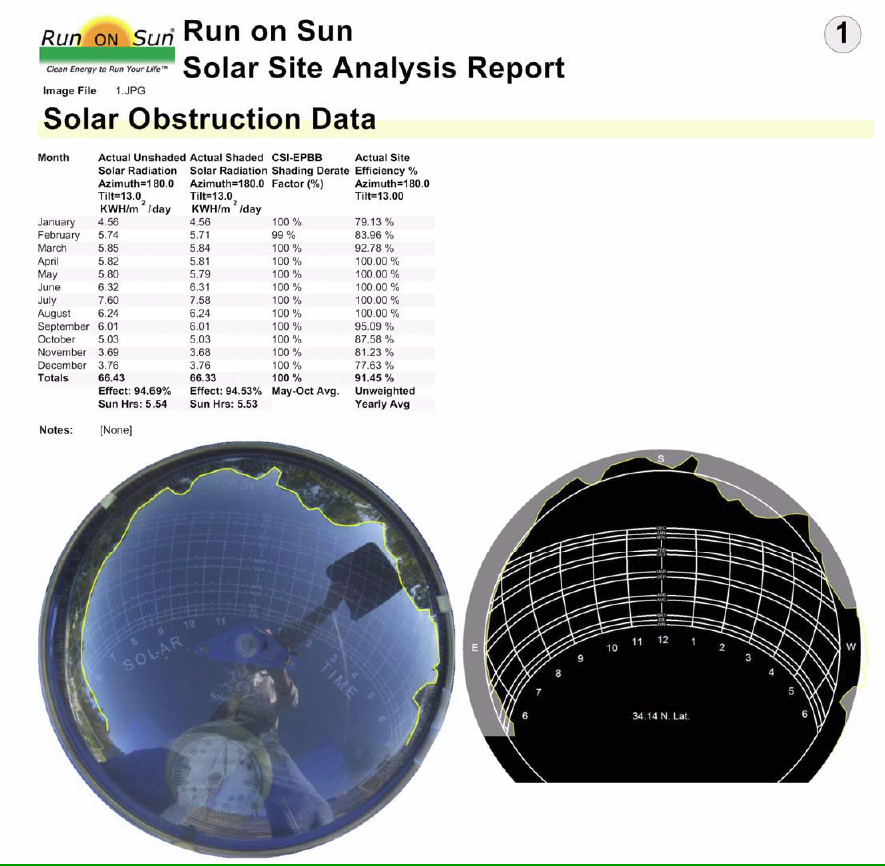 PWP wisely requires the submission of a shading analysis in addition to the output from the CSI rebate calculator. Since the amount of shading at the site directly impacts the performance of the system - and hence the CSI AC Watts of the system (or the predicted annual energy output in the case of a PBI rebate) - it really doesn’t make sense for a utility to simply trust that the installer is telling the truth about shading.
The output from the Solar Pathfinder proves that the shading numbers claimed are the shading values present at the site.
Site Plan
The site plan needed for the rebate application is a much simpler plan than what will ultimately be required for the permit, really only requiring an indication of where the various components of the system will be relative to the overall site. However, our system occupies three different areas of the PAC: the roof where the array itself is located, a ground-level storage area where our step-up transformer will be, and the utility switchgear, located on the far north end of the building. Thus our site plan included drawings for each location.
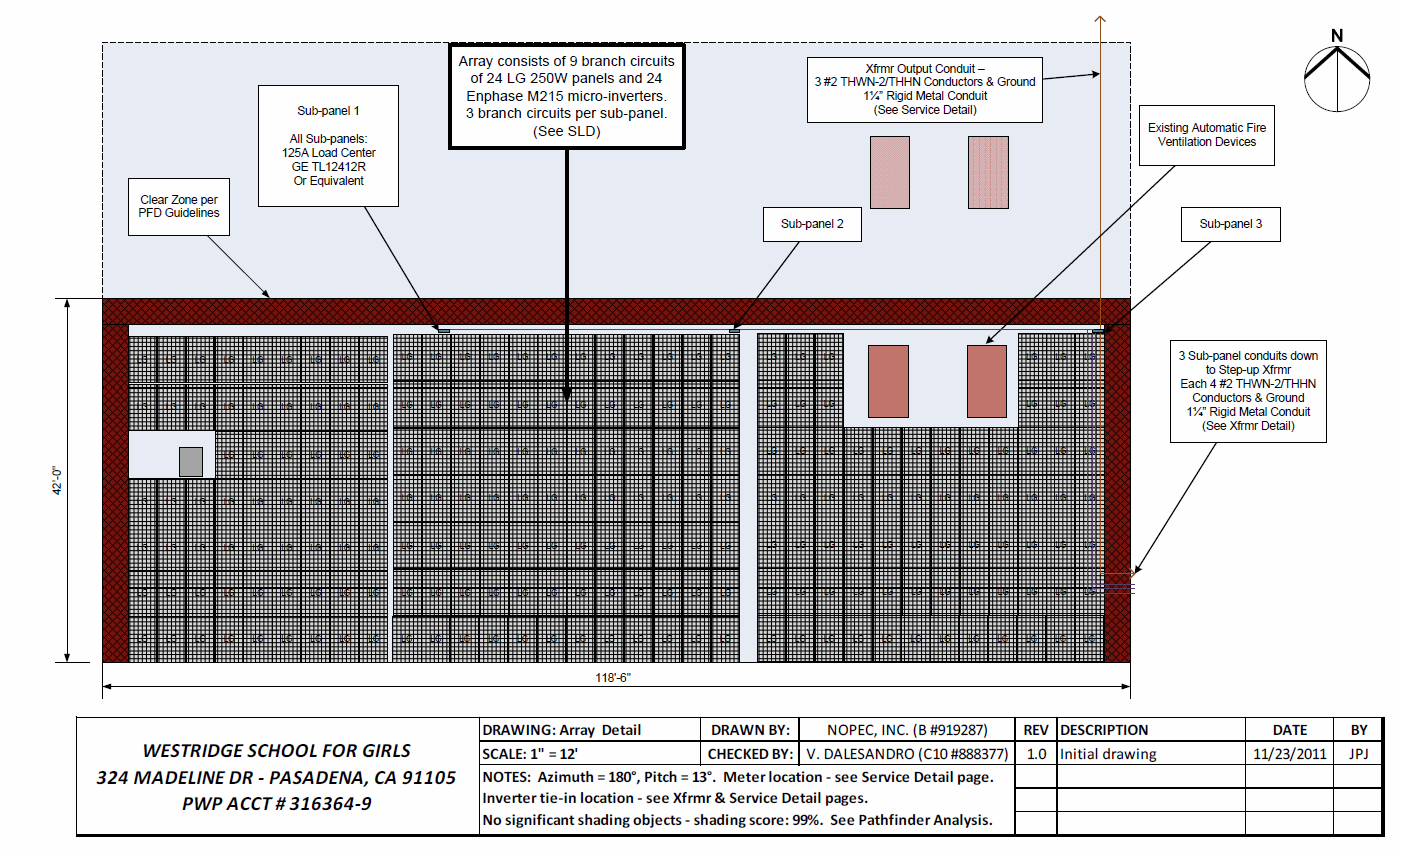 The array drawing showed the three sub-arrays and the clear space allocated for fire department access. Each sub-array consisted of three branch circuits, each of which was “center-tapped” to reduce the voltage drop in the associated branch circuits. Each branch circuit landed at a sub-array service panel which then fed a master “solar-only” sub-panel in the transformer area.
 The transformer area drawing detailed the conduits coming down off the roof (one each from each sub-array sub-panel), the master sub-panel which feeds our step-up transformer (to change the 208 VAC three-phase power coming from the roof to 480 VAC three-phase supplied by the utility service) and then a safety disconnect switch located adjacent to the transformer. From the safety switch a fourth conduit carries the required conductors back across the roof to our service switchgear area.
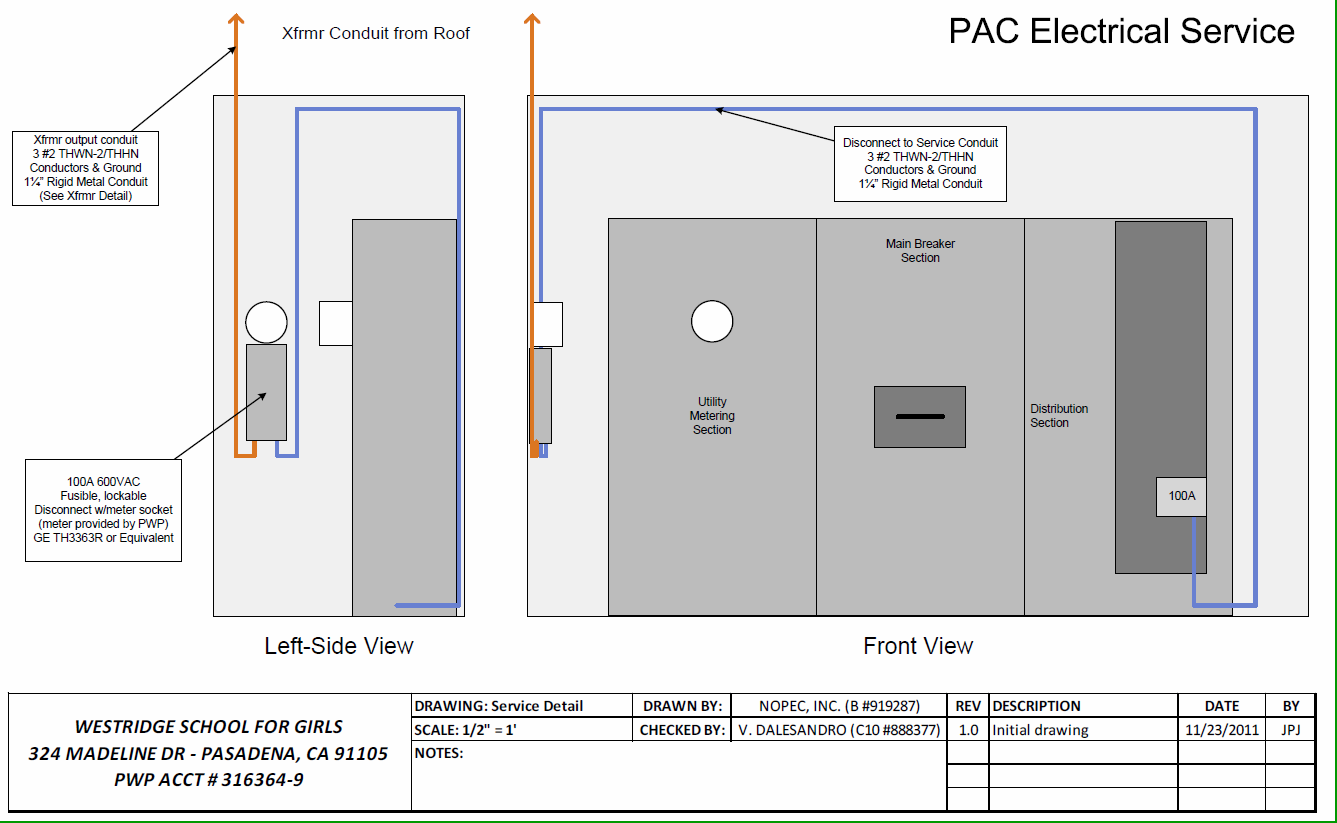 The service panel area drawing showed the placement of our lockable PV AC Disconnect, the associated performance meter, and our circuit breaker for the system located in the existing service switchgear.
Single Line Diagram
Our most significant deliverable in the rebate application packet was the single line diagram (SLD) for the electrical circuits. Since this diagram shows how all of the electrical components of the power generating system interconnect - including the tie into the utility’s grid - we knew that this would be the most closely scrutinized piece of the submission. To be sure, PWP has a generic SLD that installers can use (in fact, we helped develop it!) but that drawing does not cover the use of Enphase Micro-inverters which we were featuring on this job, nor does it allow for a step-up transformer.
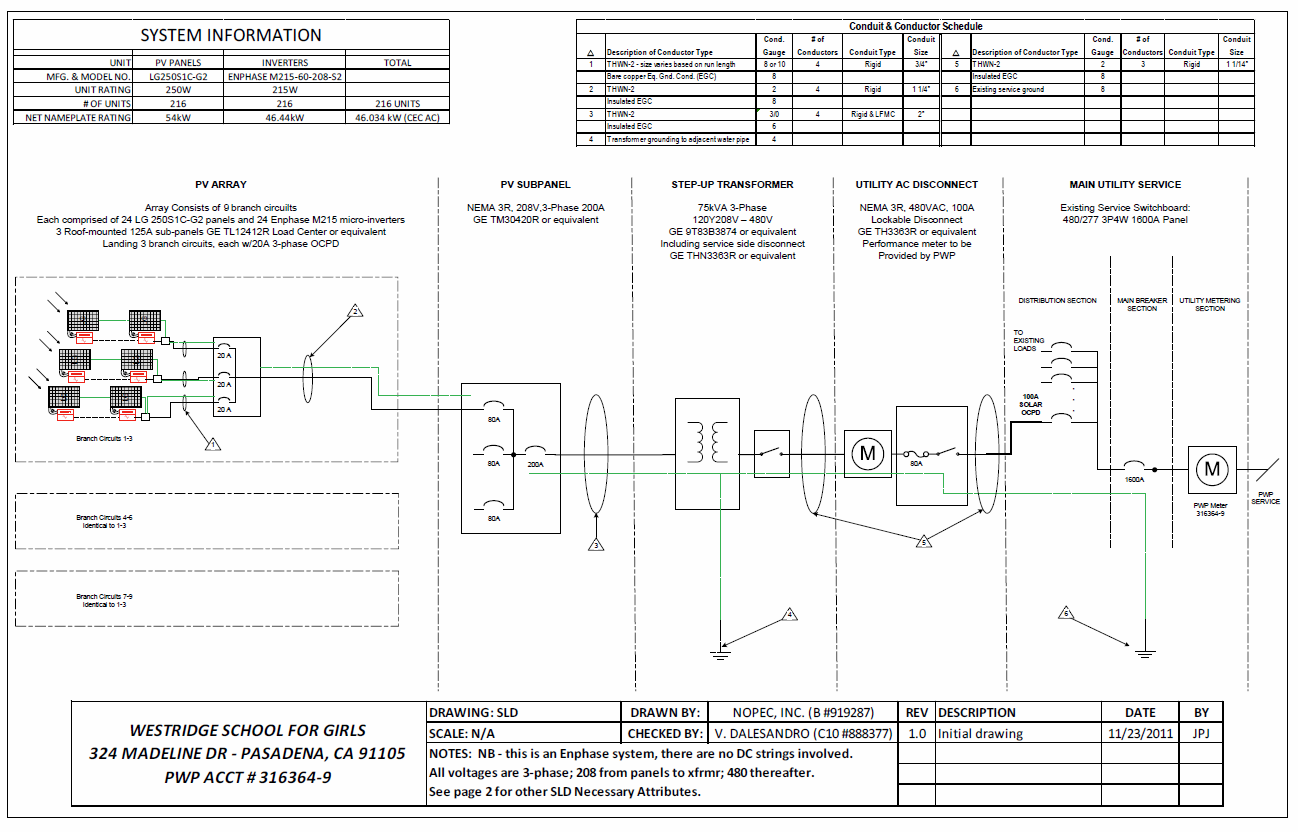 Fortunately, we had developed a very flexible SLD format from prior jobs that we could readily adapt for this project. However, before we submitted it to PWP, we forwarded it to the application engineers at Enphase Energy to make sure that they were comfortable with what we had designed. Enphase was more than accomodating - given our tight time frame they bumped us to the front of their engineering review queue and came back promplty with the good news - the design was good as we had drawn it and no revisions were needed. Of course, that was no guarantee that the utility would agree, but it is always nice to have a P.E. on your side!
Included in the SLD preparation was a complete set of voltage drop calculations. This was complicated by the fact that we had 9 different branch circuits, three different sub-panels and two different operating voltages! Good design calls for limiting total voltage drop to less than 3%. To keep our worst case scenario within that limitation (covering the branch circuit farthest from the main “solar-only” sub-panel) we ended up with 4 different gauge sizes of conductors at different legs of the run: #12 in the branch circuit cables (supplied by Enphase), #8 from branch circuit jbox to sub-array sub-panel, #2 from sub-panel to main “solar-only” sub-panel, #3/0 from that sub-panel to the transformer and then #2 from the transformer back to the service equipment area. (One change that occurred during the install process increased the length of some of these runs - and that necessitated some wire size changes to insure that we stayed comfortably below our 3% limit. Those will be discussed in future episodes.)
One Big Present
All of those documents, plus pages and pages of cut sheets describing all of the key products being used, were then submitted to PWP - one day before the deadline! With no margin for error, our submission had to be perfect. Thankfully, it was - PWP gave us their official blessing to proceed three weeks later, just three days before Christmas. One big present, indeed.
Our first hurdle successfully surmounted, it was time to prepare for the most nerve wracking part of the process - pulling the permits! That’s the subject of our next installment - stay tuned!
12/06/11
Categories: All About Solar Power, PWP Rebates, PWP, Non-profit solar, Westridge PAC Project
Westridge Chooses Run on Sun for 54kW Solar Project
We are very pleased to report that one of the premier schools in Pasadena - or pretty much anywhere for that matter - the Westridge School for Girls has just selected Run on Sun to design and install a 54 kW solar power system on the Fran Norris Scoble Performing Arts Center.
Come the Spring, Solar Panels will bloom here!It is very gratifying to have been chosen over some tough competition for this project, particularly given the School’s well-established commitment to sustainability. Indeed, just last year Westridge dedicated a new science building which has received the coveted, but very rare, LEED Platinum designation. Now as part of Westridge’s plan to “green” all of the campus, the 54 kW solar power system will be another dramatic step in that direction.
Even better, since the project will use Enphase micro-inverters, the students from grades 4-12 will be able to study the performance of the system right down to the individual panel level. We look forward to working with the Westridge faculty and administration as they teach their students about the difference that solar power can make in their lives.
At Run on Sun we have a special place in our hearts for working with non-profits and we would love to help your non-profit add solar too!