Category: "Westridge PAC Project"
05/25/12
Categories: All About Solar Power, Westridge PAC Project
Solar Eclipse - A Data Geek's View
On Sunday, May 20, 2012, an annular eclipse was visible in large parts of the United States, including here in Pasadena. To the data geeks here at Run on Sun, that gave us a view to the eclipse that was just a bit different - a Data Geek’s view, if you will.
One of the great things about having a solar power system that is monitored - particularly with a system like Enlighten from Enphase - is that it automatically captures a great deal of data and sometimes that data can be used to look at some surprising things - like a solar eclipse! So this will be a brief tutorial on how to take a raw data set and turn that into a graphical representation of the solar eclipse. (We used Excel 2010 for our analysis, but any tool that allows for the creation of pivot tables should allow you to do the same thing.)
Hypothesis
We started out with a simple hypothesis - since the annular eclipse covered as much as 80% of the sun’s surface (as seen from SoCal), we would anticipate that there would be a significant impact on the output of a solar power system during the eclipse. If we looked at the data from the days prior to the eclipse (excluding any days that were dominated by cloud cover during the relevant time when the eclipse occurred) we should see a noticeable decline in system output relative to the other days. If we graphed those days on the same graph, the eclipse should be an obvious outlier.
But to test our hypothesis, we would need to gather some data!
Data, data, data…
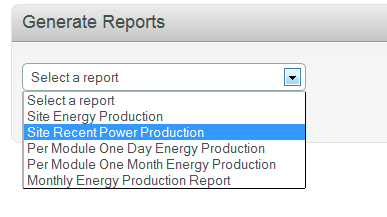 The Enphase Enlighten website allows a system owner to access a variety of reports about how the system has been performing. One of those reports is titled “Site Recent Power Production” and it provides a comma separated values (csv) file that contains the site’s power output over five minute intervals for the preceding seven days.
Excel will open the .csv file and once you have it opened, you can begin the process of massaging the data into the form needed to “see” the eclipse. (If you care to follow along, you can download the dataset that we used by clicking on this link.)
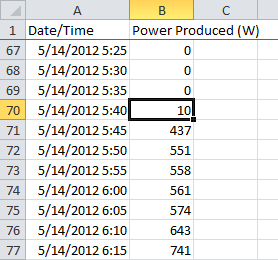
The raw data consists of two columns: a time stamp value and the power produced at that moment in time in Watts. The time stamp combines the full date with the time of day, and as you can see here, the time increases in five minute intervals. Altogether, our week’s worth of data consists of 2,016 data pairs which we will ultimately want to graph.
However, we want to partition the data into seven discrete days (which will then be graphed on top of each other), with hours of the day and five-minute intervals on the X-axis. To achieve that end, we need to add some columns based on the time stamp value. Fortunately, Excel has a number of built-in functions that will let us do exactly what we want to do with a minimum of effort.
By-the-way, it is interesting to note that the system is already generating a significant amount of power by 5:45 in the morning! The system being monitored has 209 solar panels which means that at 5:45 we were receiving, on average, just over 2 Watts per panel.
This ability to produce power at very low levels is another way in which a microinverter system helps to maximize overall system yield.
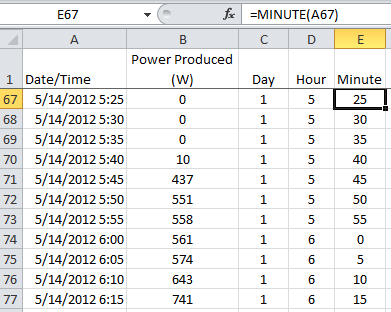
We continue this process by creating columns for the hour and the minute. Fortunately, this is nothing more than using the built-in “hour” and “minute” functions from Excel. By selecting our date/time field with hour and minute, we can establish the remaining data fields that we will need.
However, we now have lots of rows of data to process and making sense of that can be difficult—difficult, that is, unless you use pivot tables.
Pivot Table to the Rescue!
Now we are ready to create our pivot table. For those of you who do not know, pivot tables are a data geek’s best friend, and the means by which massive amounts of data gets distilled into a meaningful table - and ultimately a graph. There are lots of things that you can do with a pivot table but the one we will be using here is very simple.
On the insert tab choose pivot table. For the data source select the power column and the three new columns that we just created. You can embed the table on the current worksheet or in a new one.
Then do the following:
- Select the “Day” field and drag it to the “Column Labels” box.
- Select the “Hour” field and drag it to the “Row Labels” box.
- Do the same thing with the “Minute” field.
- Now drag the “Power Produced” field to the “Values” box. Note that it gets labeled as “Count of Power Produced (W)” in the box and all of the data values are “1″s. What Excel is doing is counting how many power values there are for each five-minute interval - not what we want.
- To change it, click on the down arrow next to the field and select “Value Field Settings…” Where it says “Summarize value field by” change from Count to Sum and click OK.
- Click on the heading “Column Labels” and type Days.
- Do the same for “Row Labels” and enter Hours/Minutes.
- We don’t need the “Grand Total” so right mouse on that heading and select “PivotTable Options…” Click on the “Totals & Filters” tab and deselect both of the Grand Totals options.
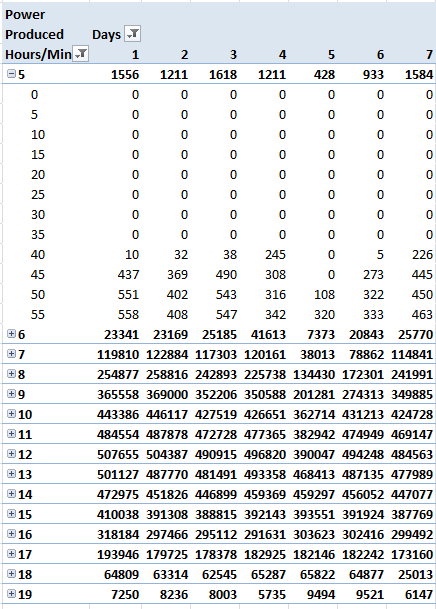
If you’ve followed along correctly, you should have a pivot table that looks like the one on the right.
Click on the drop down filters and deselect the “blank” value for both Days and Hours/Mins. Also, we only want hours where the total power exceeded zero watts, so select Value Filters from the Hours/Minutes drop down. Select Greater Than… and enter 0.
Now we are ready to create our graphs.
A Picture is Still Worth a Thousand Words!
We have distilled our 2,016 rows of raw data into a more manageable form, but it is still hard to “see” our eclipse - time to graph this and let the data speak for itself!
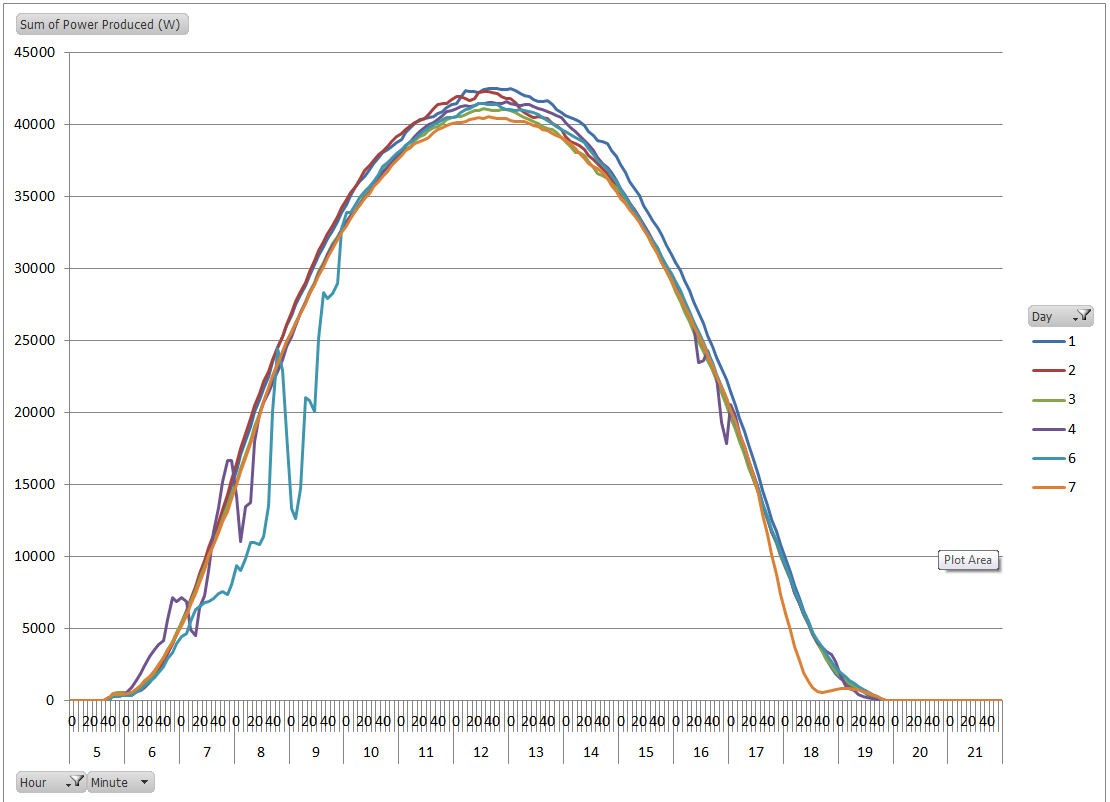
From the PivotTable Tools menu, choose options and then click on PivotChart. Choose a Line chart from the pop-up. Right mouse on the chart and select “Move Chart…” to move it to a new worksheet. This looks pretty good, but Day 5 is very noisy - let’s exclude it. Click on the Day drop down and deselect Day 5. That’s our eclipse graph on the right.
Can you “see” the eclipse now? The chart is still quite busy; let’s exclude some additional days to see if we can make this cleaner.
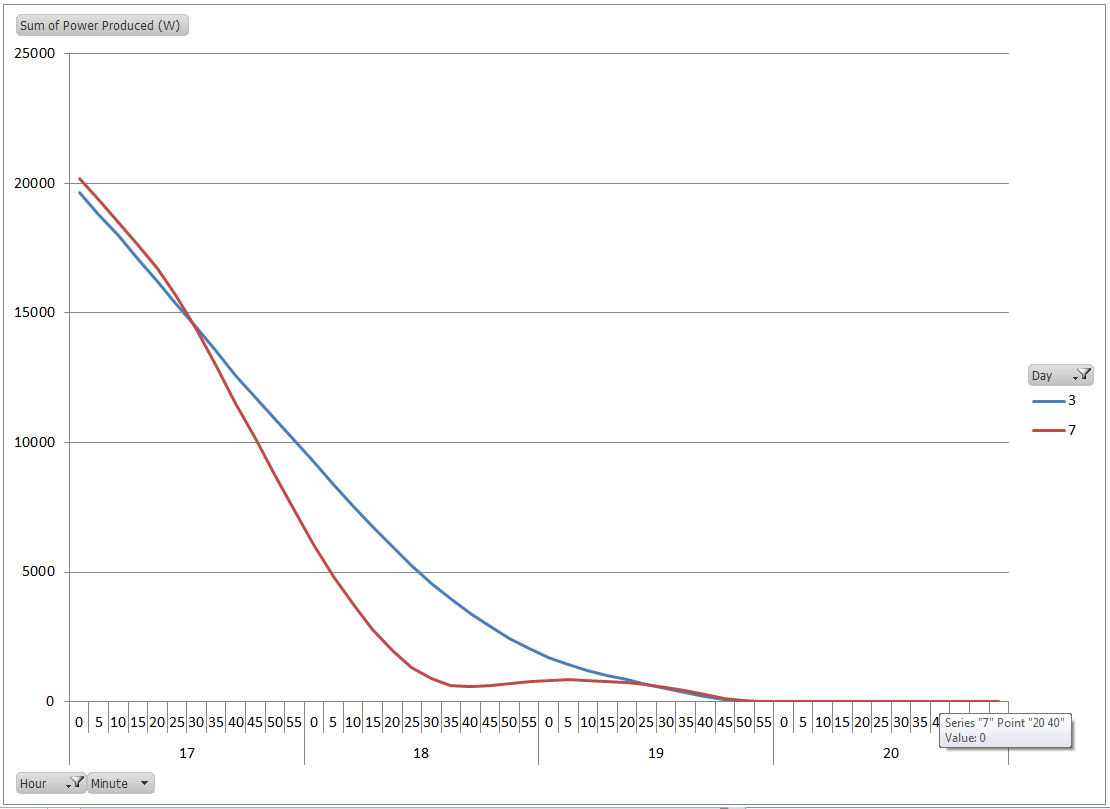
Return to the Day drop down and exclude every day except days 3 & 7. Now our new graph just tracks two days and we excluded a lot of distractions from what we were seeking.

Here’s our new graph:
The graph clearly illustrates that these two days saw almost identical power production for the vast majority of the day, until late in the afternoon. The timing of that sole difference coincides with our eclipse - can we zoom in for a closer look?
Easily enough we can - all we need to do is limit the time span displayed to the time period associated with the eclipse. The eclipse began around 5:25, reached its maximum roughly an hour later and was over by an hour after that. By selecting the Hour drop down filter we can limit the time period to the four hour window between 5 and 8.
Here is our final “view” of the eclipse:
Our final graph clearly depicts the impact of the eclipse on the power output of our solar array.
Monitoring systems are generally considered an important part of commercial solar systems since they help the system owner maximize their investment. However, this is just one example of how a monitoring system can also be used as a tool to observe and quantify other real world phenomenon - making this an important adjunct to a solar power system at a school - like this one at the Westridge School for Girls in Pasadena.
05/04/12
Categories: Commercial Solar, Non-profit solar, Westridge PAC Project
Putting it All Together - Installing Solar at Westridge - Part 5
Here it is - our video from our 52.3kW solar project at the Westridge School for Girls here in Pasadena. Enjoy!
You can follow this link to see the complete series:
Installing Solar at Westridge.
Categories: All About Solar Power, PWP Rebates, PWP, Commercial Solar, Non-profit solar, Westridge PAC Project
Westridge Project Grabs Pasadena Weekly's Green Issue Front Page!
 Readers of this blog will know all about the 52.3kW solar project that Run on Sun just recently completed installing at Pasadena’s renowned Westridge School for Girls. Now that project has become the cover story in the Annual “Green Issue” of Pasadena Weekly.
Titled, “Solar Flair: New solar installation at Westridge School brings environmental lessons to life,” the piece features interviews with Westridge’s Head of School, Elizabeth McGregor, Facilities Manager Brian Williams, and three students who are part of the school’s environmental group known as the Green Guerrillas. The story reveals the school’s deep commitment to sustainability in everything from solar power to drought tolerant plants.
This first of what we hope will be many solar projects at Westridge really highlights the value of these projects for all schools, especially those in the Pasadena Water and Power service territory. Good rebates and a solar company that really understands your goals makes a solar power system installed by Run on Sun a “no-brainer.”
Contact us today and let’s get going with YOUR solar project!
Categories: Commercial Solar, Non-profit solar, Westridge PAC Project
On the Roof - Installing Solar at Westridge - Part 4
Our first three installments saw us secure our rebate reservation, successfully pull our permits, and deal with a host of challenges on the ground. But now the real fun starts - in this episode we will document the heart and soul of this project, “Up on the Roof!”
Projection
Solar projects actually begin on a computer screen as the designer tries to map what is known about the roof, the utility service, and the client’s needs into a coherent proposal. As the project progresses through the rebate and permitting processes, that design is refined - and as we have seen, sometimes altered. But the trick of any implementation is to go from the designer’s plan to an actual system on the roof - starting with getting the attachments in place.
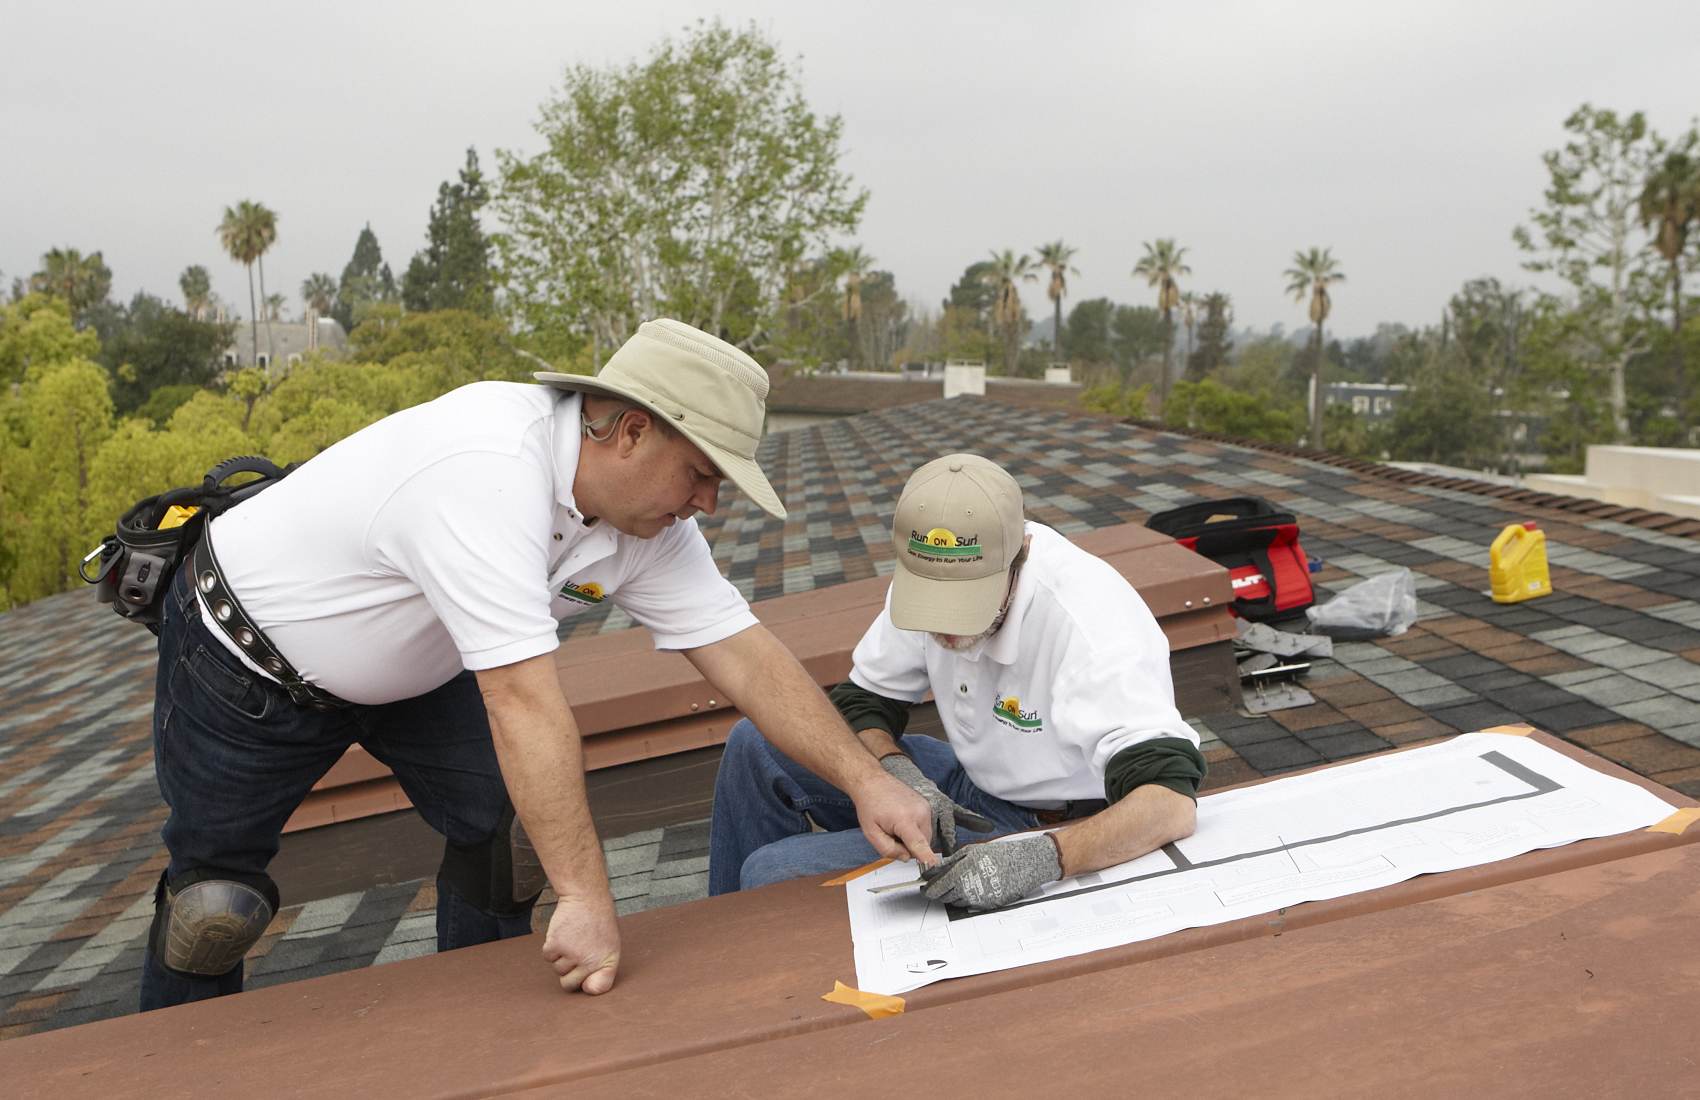 Nearly ancient methods, tape measures and chalk lines, are the essential tools in this process. Since a solar array is essentially a grid, the trick is to project what is on the plans into a corresponding grid on the roof. Precision and accuracy are the key to making this work, but roofs are notoriously inconsistent places! What seemed to be square, isn’t always. What appeared to be flat, actually has its own peaks and valleys. While our projection onto the roof proved easy enough, we were about to discover that what you see - or were told - isn’t always what you get!
There’s What You Plan and What You Get
Our biggest design challenge had been the need to account for the somewhat unusual roof construction that we had to accommodate. In particular, our underlying roof structure was a 20 gauge, type B steel deck, overlayed with multiple layers of plywood, foam insulation and roofing materials. Given the thickness of those layers we had determined that we would need to use four, 8-inch-long, self-tapping screws to secure our “FastFoot” anchors to the roof. We had purchased hundreds of those screws - along with a top-of-the-line Hilti cordless driver - to do the job. But something wasn’t right.
As we started making our first few attachments it was clear that not all of them were reaching the steel deck! Apparently in some places the actual thickness from the roof to the deck exceeded the 8″ reach of the screws. Visual inspection from a scissors lift inside the building confirmed what we suspected - clearly not all of the screws were penetrating the deck, yet in other places, all four screws penetrated without difficulty. There was only one solution to the problem of our inconsistent roof - longer screws!
Fortunately, we were able to order some 9″ screws from the manufacturer - the longest that they made. They did the trick - now we could be certain that every FastFoot plate was properly secured.
Lean on Me
The changes to our plans imposed during the permitting process meant that we were very tight on space. At the top of our array we had to install 3 sub-panels, each of which had to handle three branch circuits that made up that sub-array. Our original plan was to build a triangular cross brace out of unistrut to support the sub-panels.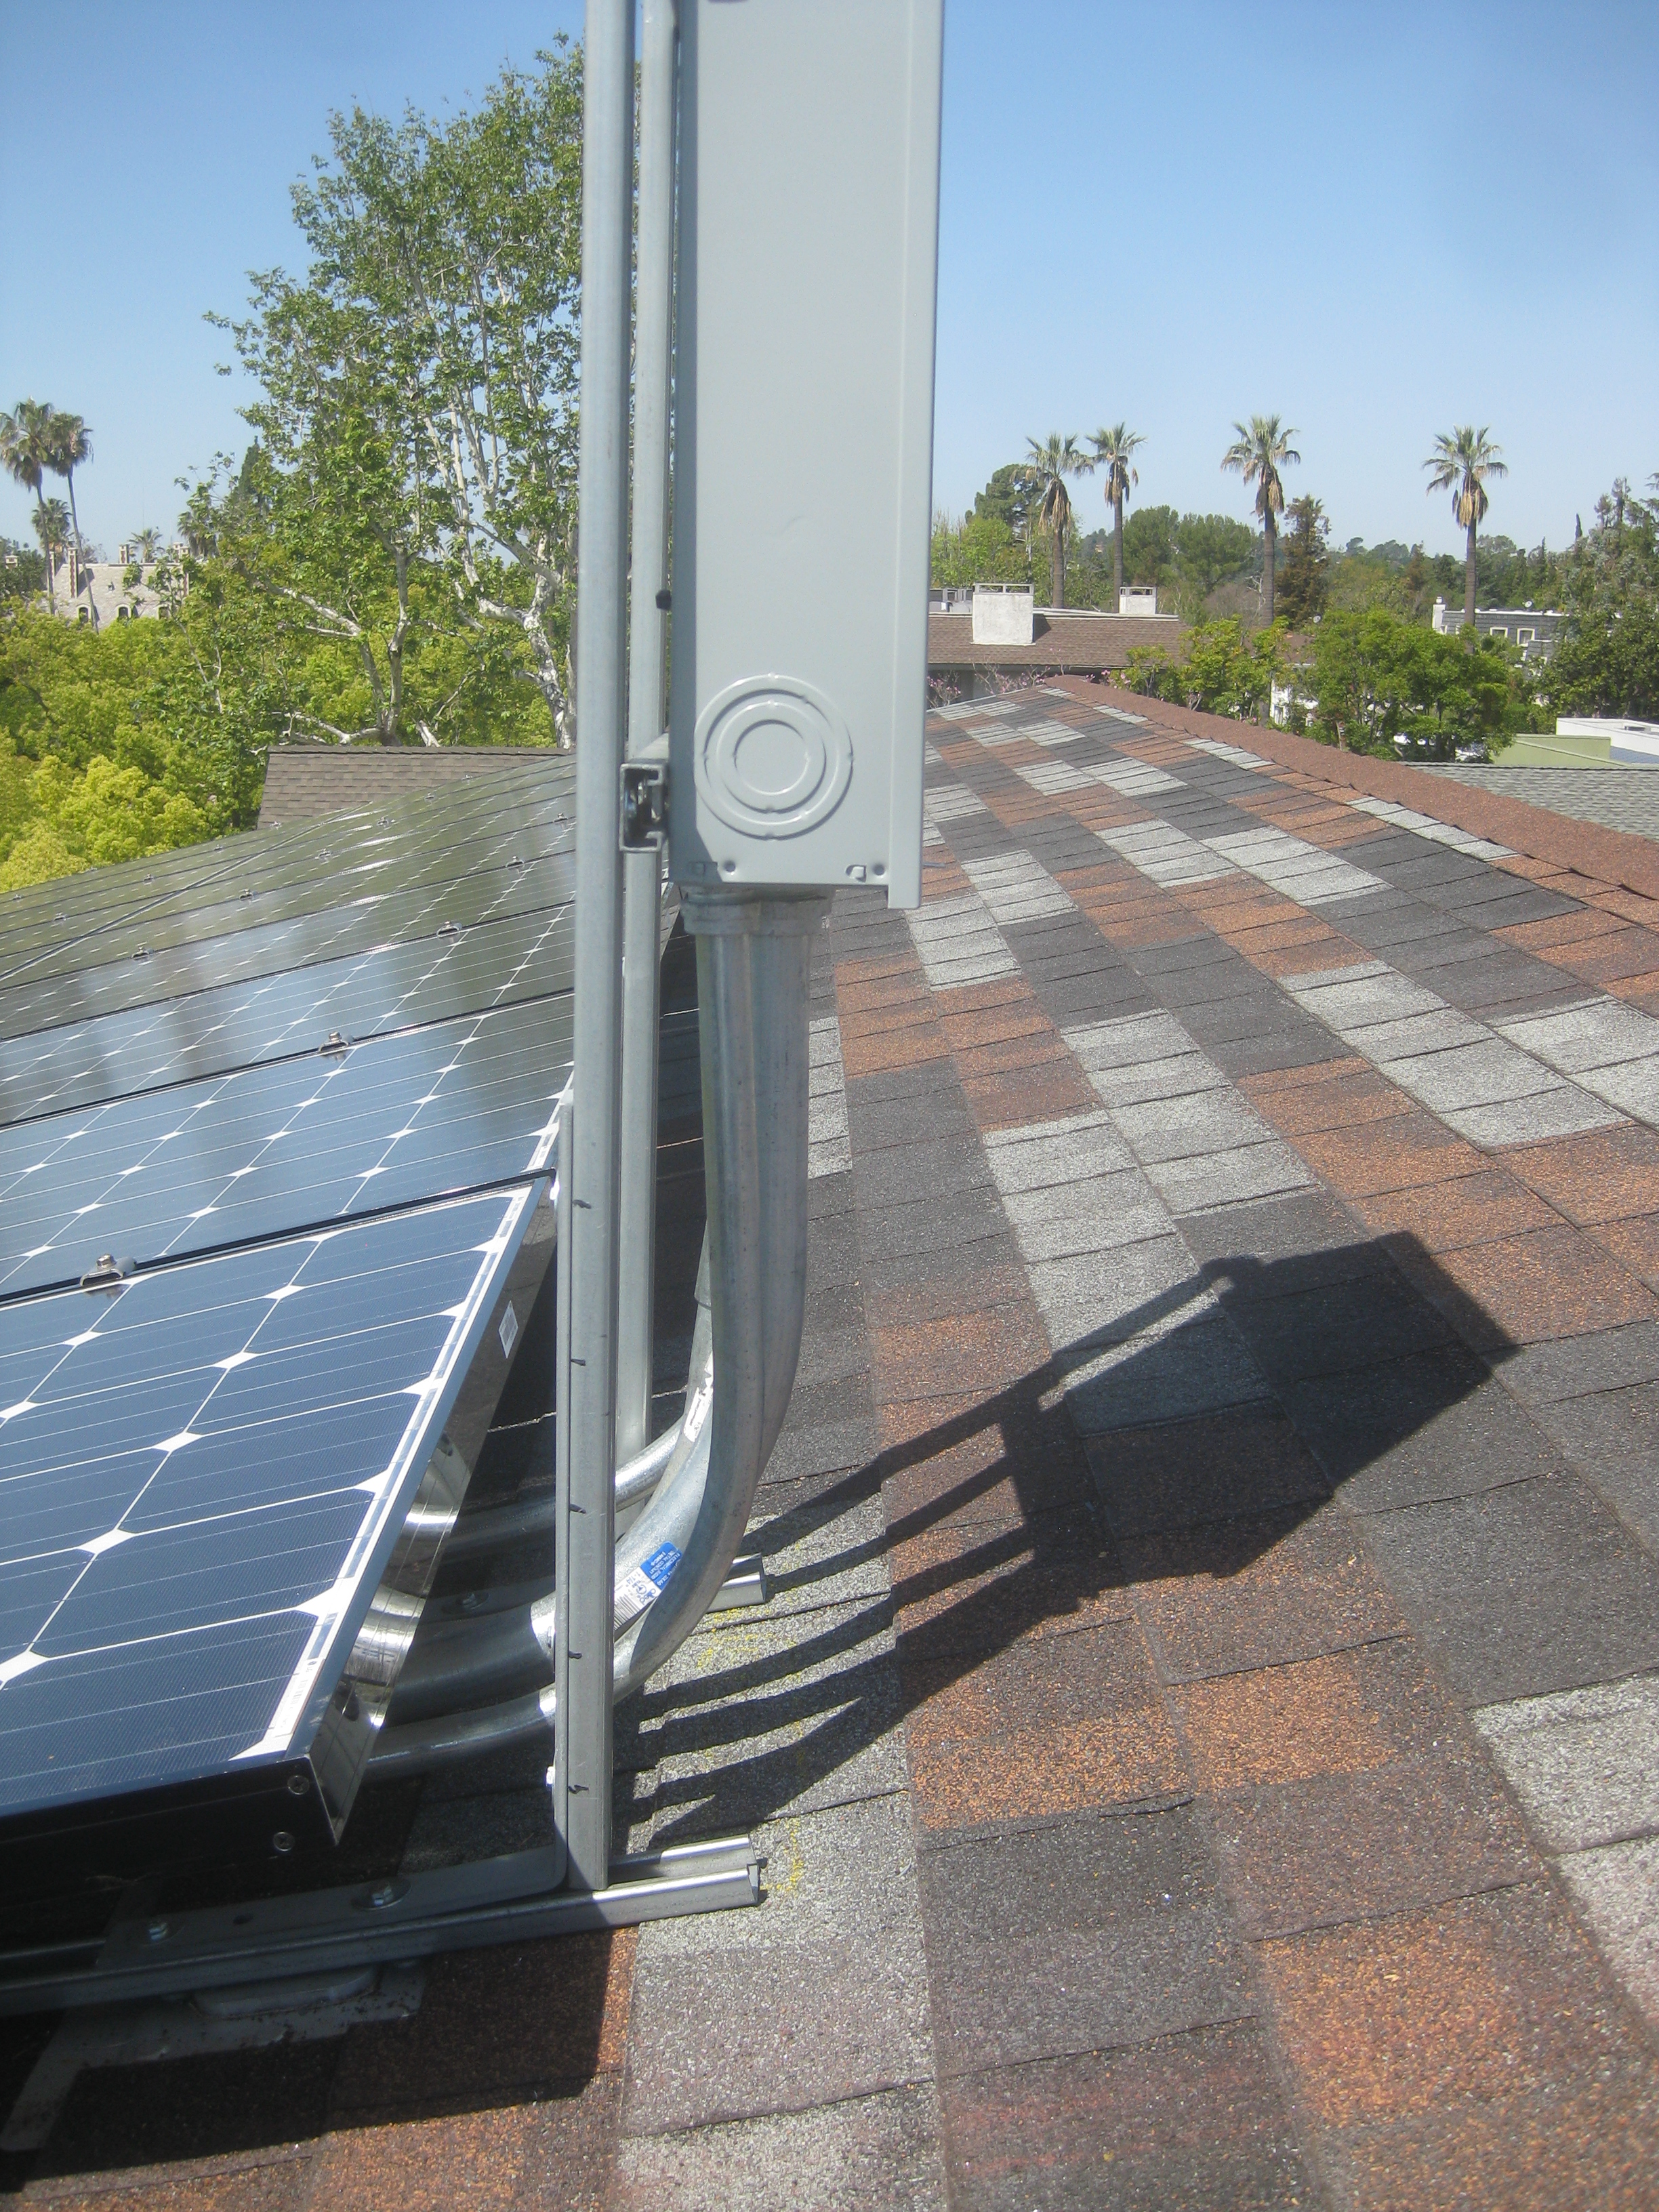 Unfortunately, given our close quarters, the solar panels needed to come right up to the supports for the sub-panels - a cross-brace system would take up too much space.
Instead, we designed a set of steel braces that were bent at precisely the angle that we needed - 103° - to allow our sub-panels to be perfectly vertical on our 13° sloped roof. The design was easy, but could we get them fabricated fast enough to keep the project on track? We knew of a small metal shop near our offices and we took the design to them - yes, they said, they could produce the six parts that we needed for $100 and they would have them in the morning - would that be soon enough?!!!
This turned out to be a very elegant solution to our problem. Using two FastFoot anchors, we attached unistrut to them and then bolted our braces to that. When combined with the rigid conduit feeding the sub-panel, we ended up with a very solid solution.
Next problem!
Need a Lift?
The roof of our building was reachable by a series of three ladders traversing three different roof levels. 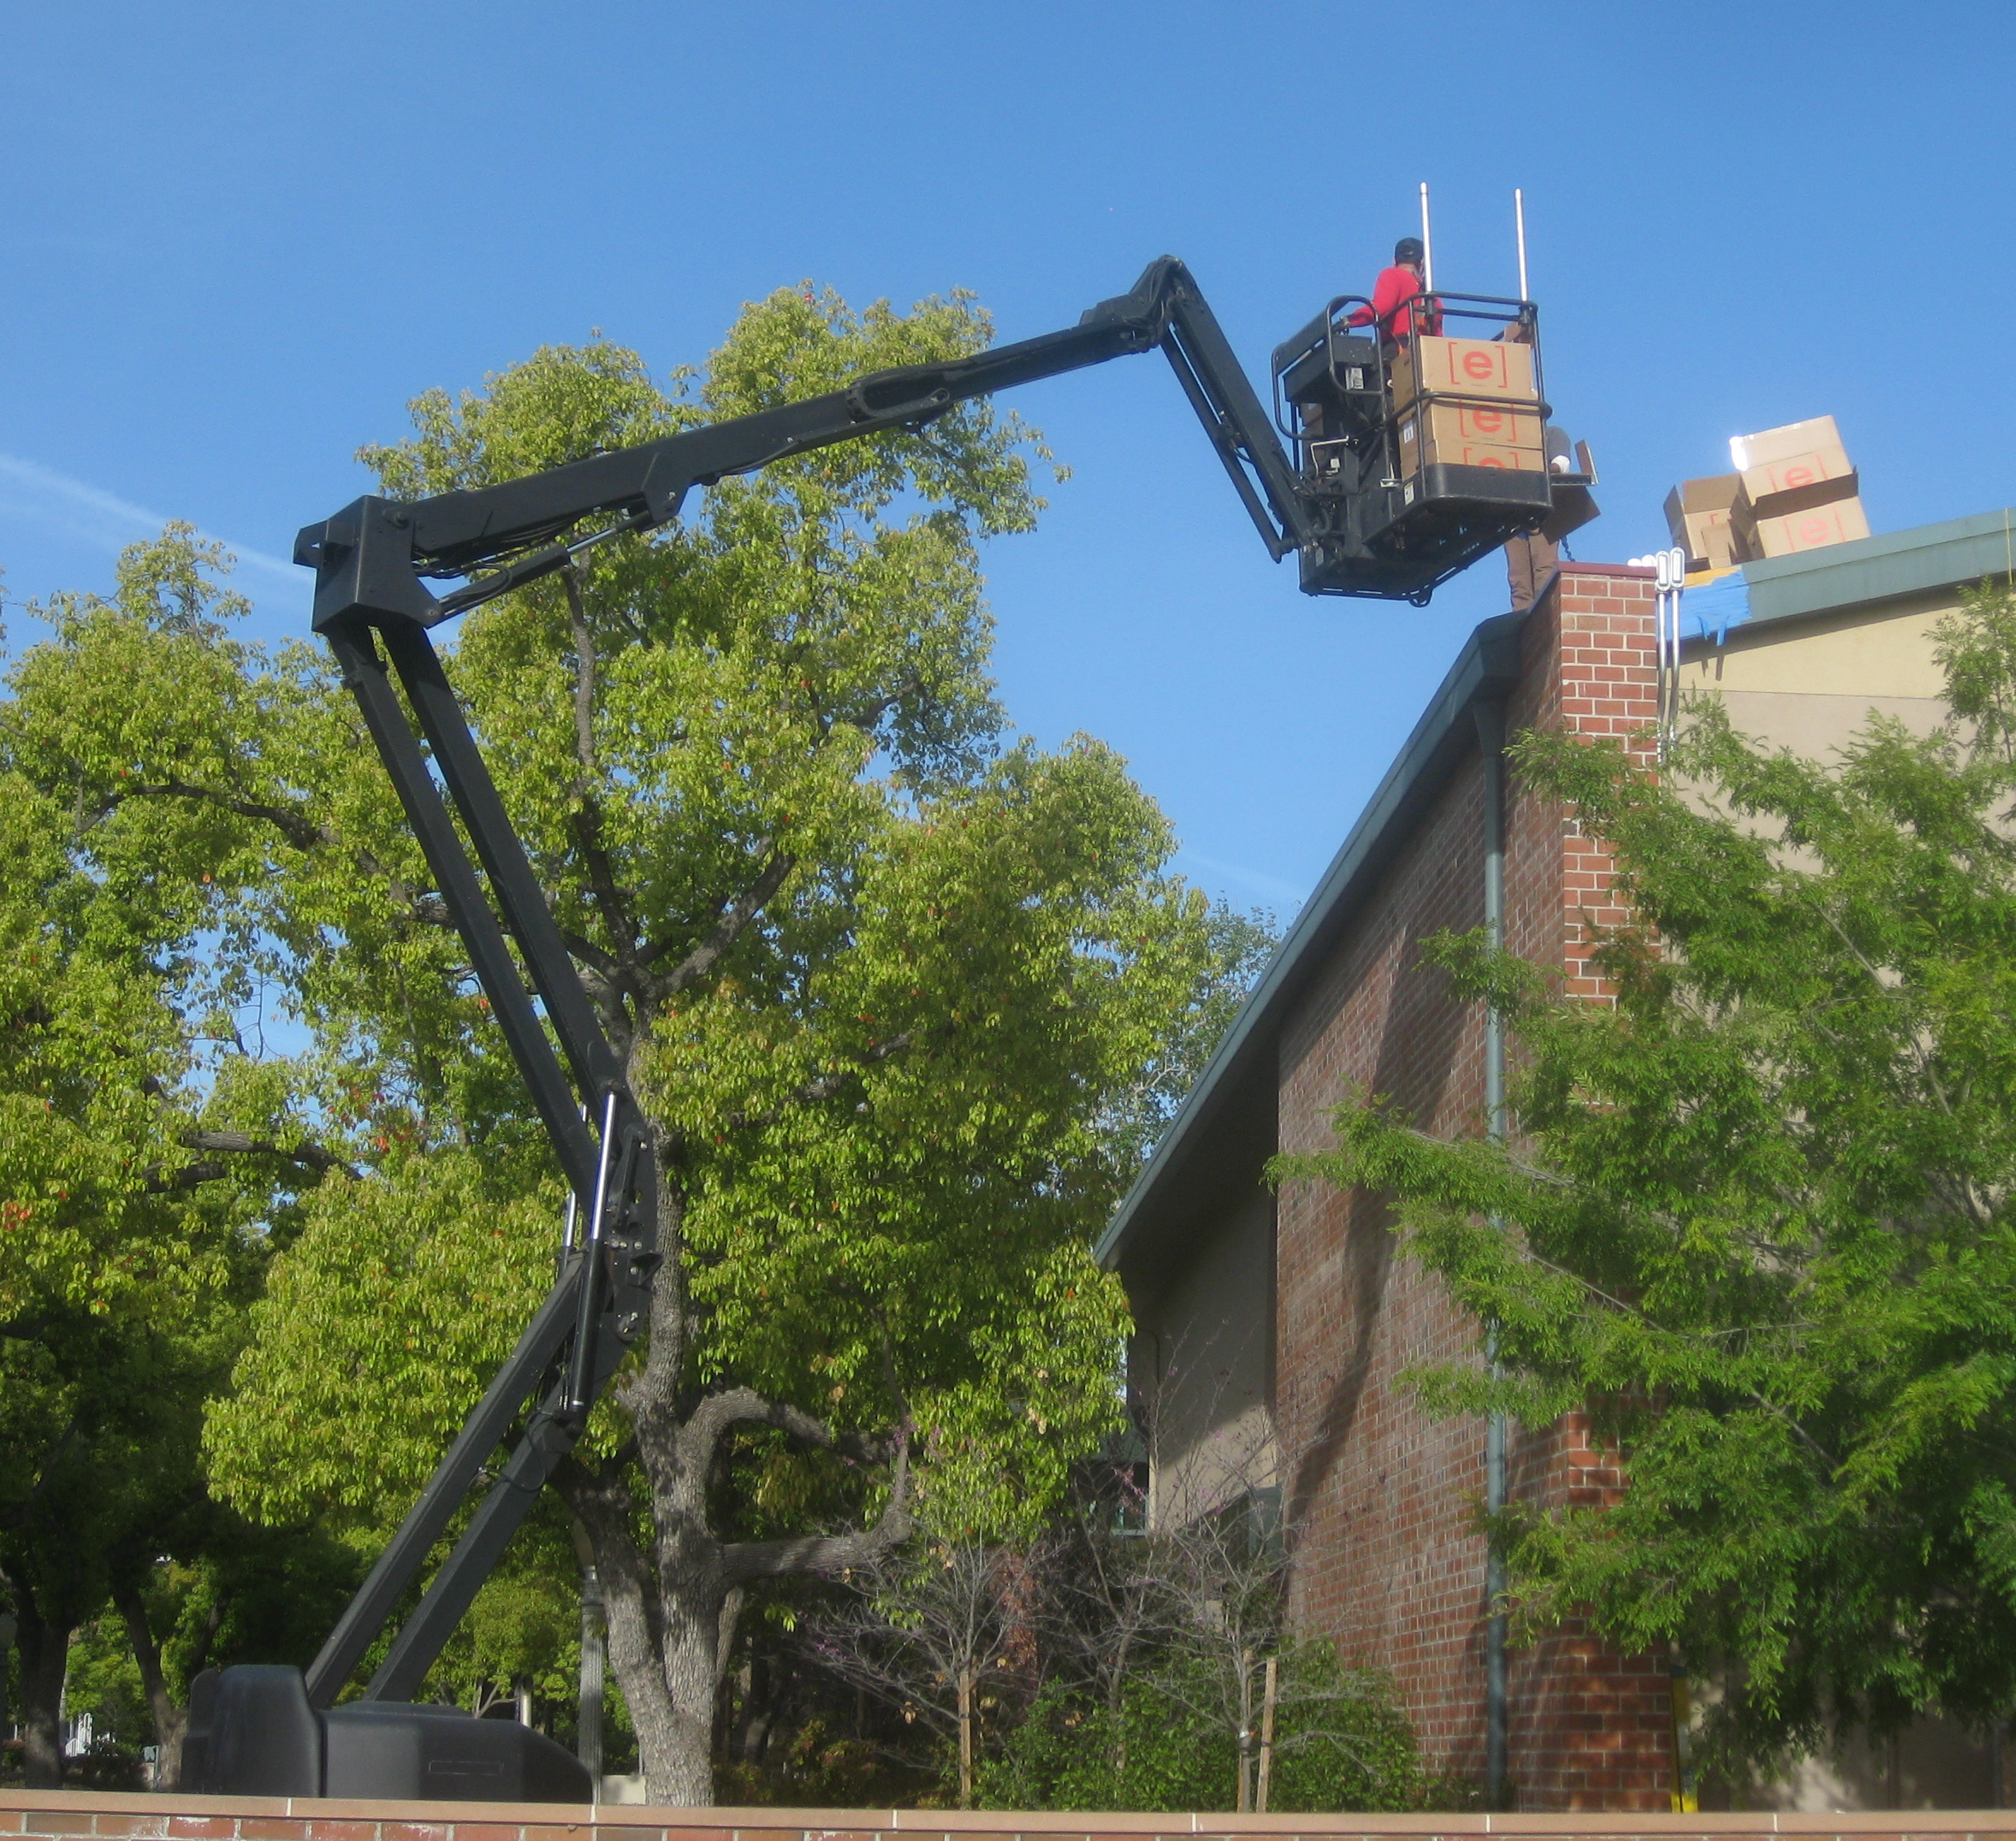 While this was acceptable for getting personnel to and from the roof, it would never work for transporting hundreds of feet of rails, to say nothing of 209 solar panels!
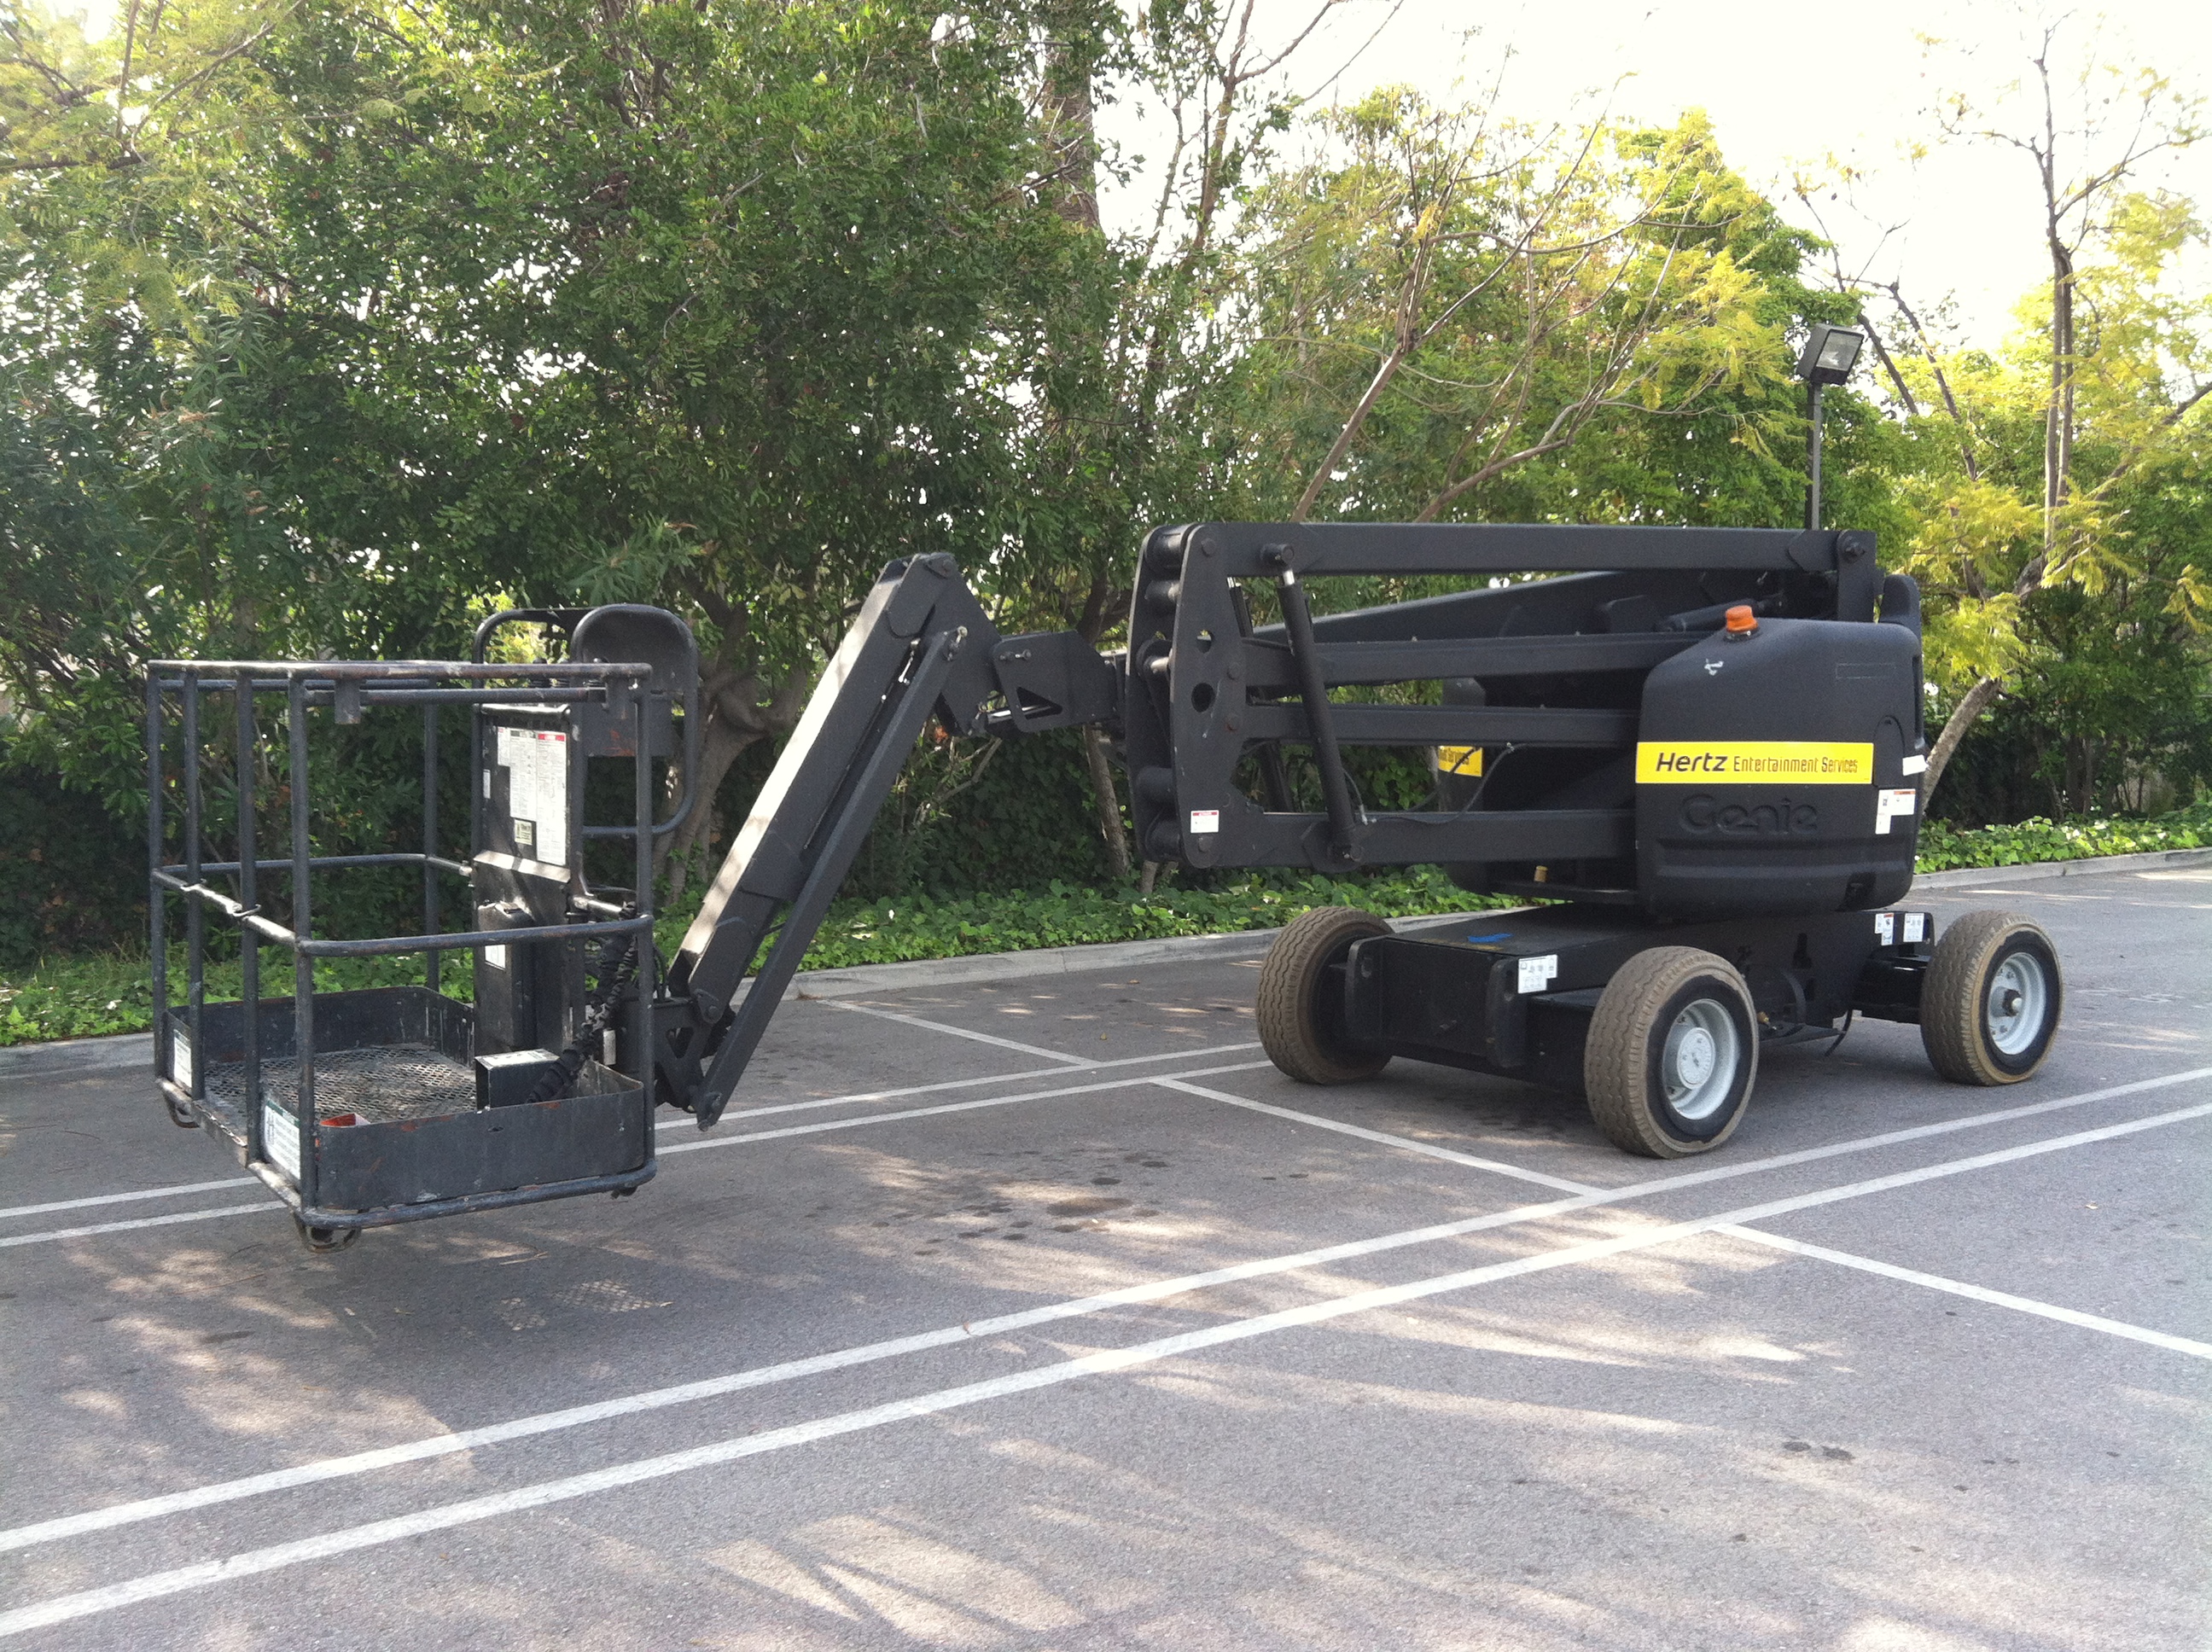
Enter the boom lift - the same one that was unceremoniously dropped off for us by parking it under a No Parking sign!
Whether transporting rails, solar panels, or the Enphase micro-inverters as you see in this picture, the boom lift provided us with an efficient means of moving large amounts of gear up to our work site on the roof. Operating a device that articulates in multiple dimensions in relatively tight quarters takes skill and great attention to detail. (It also makes for some pretty cool looking photos!)
Connect the Dots
Once the rails were installed, the Enphase micro-inverters could be mounted and the process of running a continuous ground wire and the creation of the Enphase map could begin.
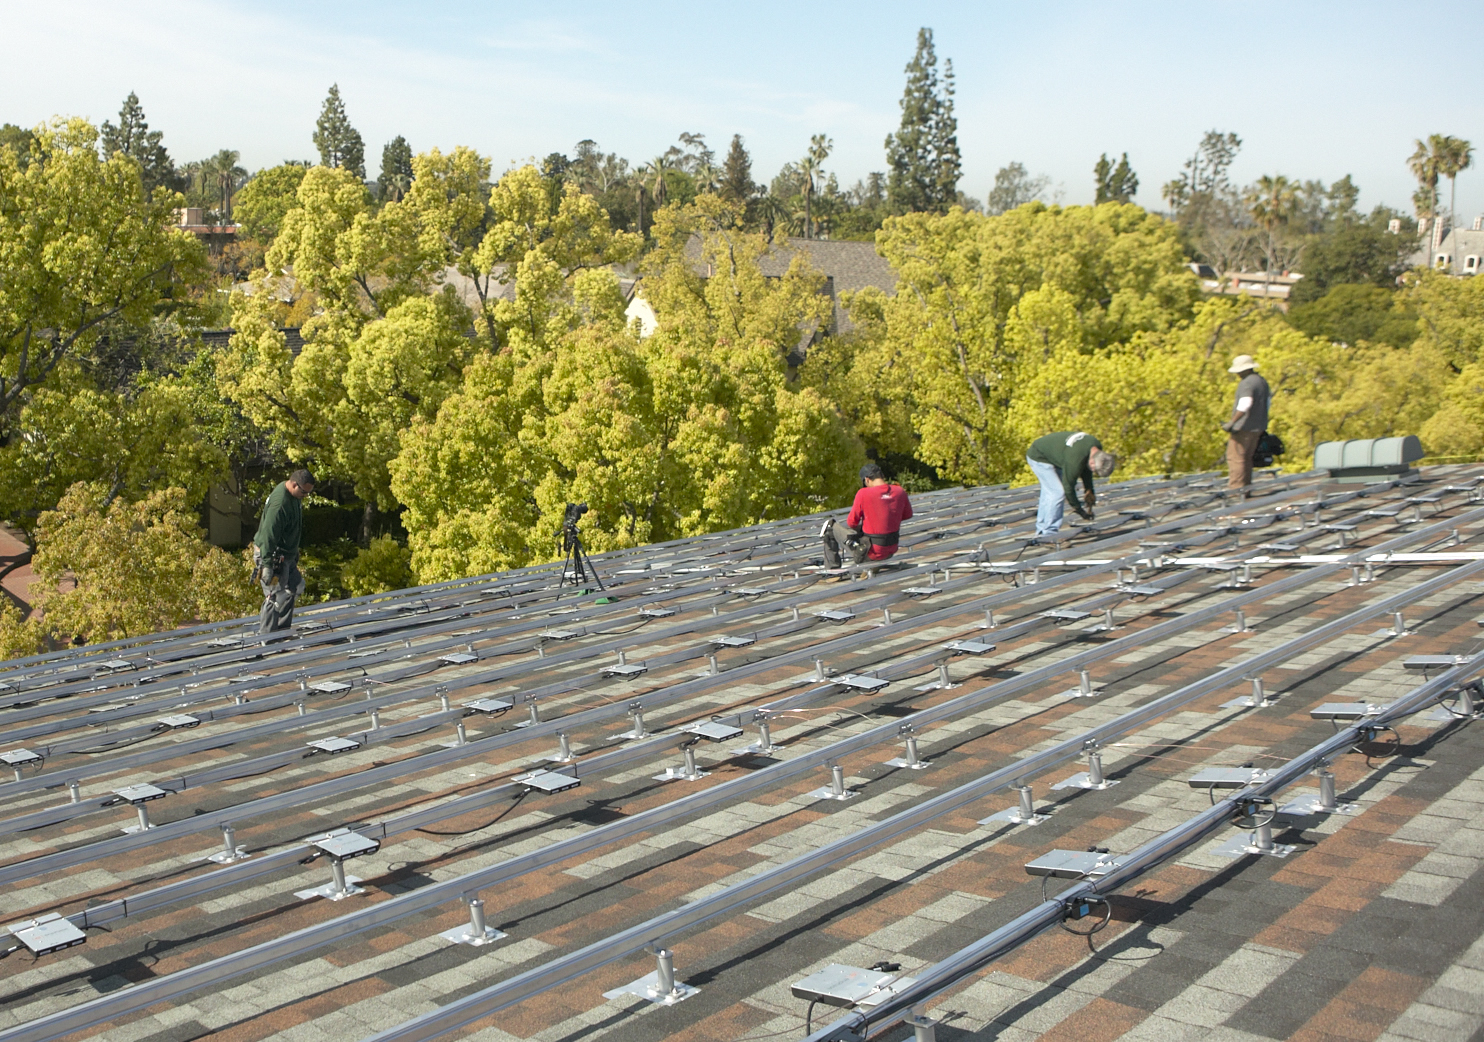
Since this was an Enphase system, we would be able to monitor the performance of the array down to the individual solar panel/micro-inverter pair. (Indeed, this monitoring ability was a key selling point for the system to the school as it nicely meshed with the school’s educational mission - more on that in our upcoming video!) Each micro-inverter has a serial number that was carefully peeled off and affixed to a “map” that showed where each inverter was located on the roof. As part of the commissioning process, we transferred the map data onto the Enphase website and built a true representation of how the system was laid out on the roof.
Now all we needed was to install the solar panels themselves!
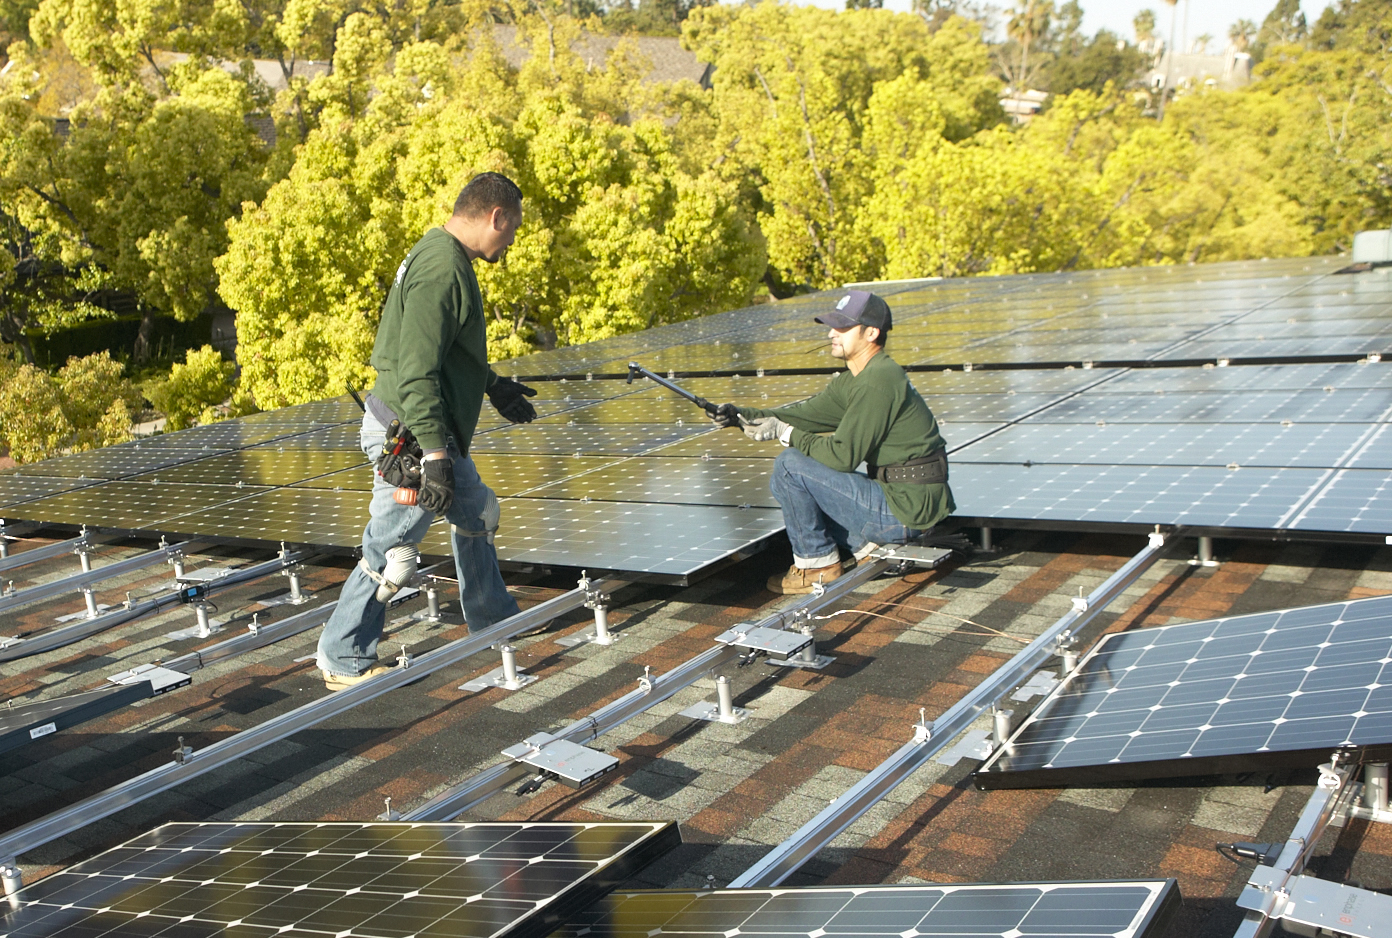
Careful attention to detail during this last step is rewarded with an array that aligns precisely and fits as planned. Using the Enphase Envoy and a laptop computer, we could verify that each and every panel was properly connected and functioning as expected. We could be confident that there would be no surprises that would need to be resolved later!
That gave us one last task for the boom lift - finished photographs. Here’s our favorite:
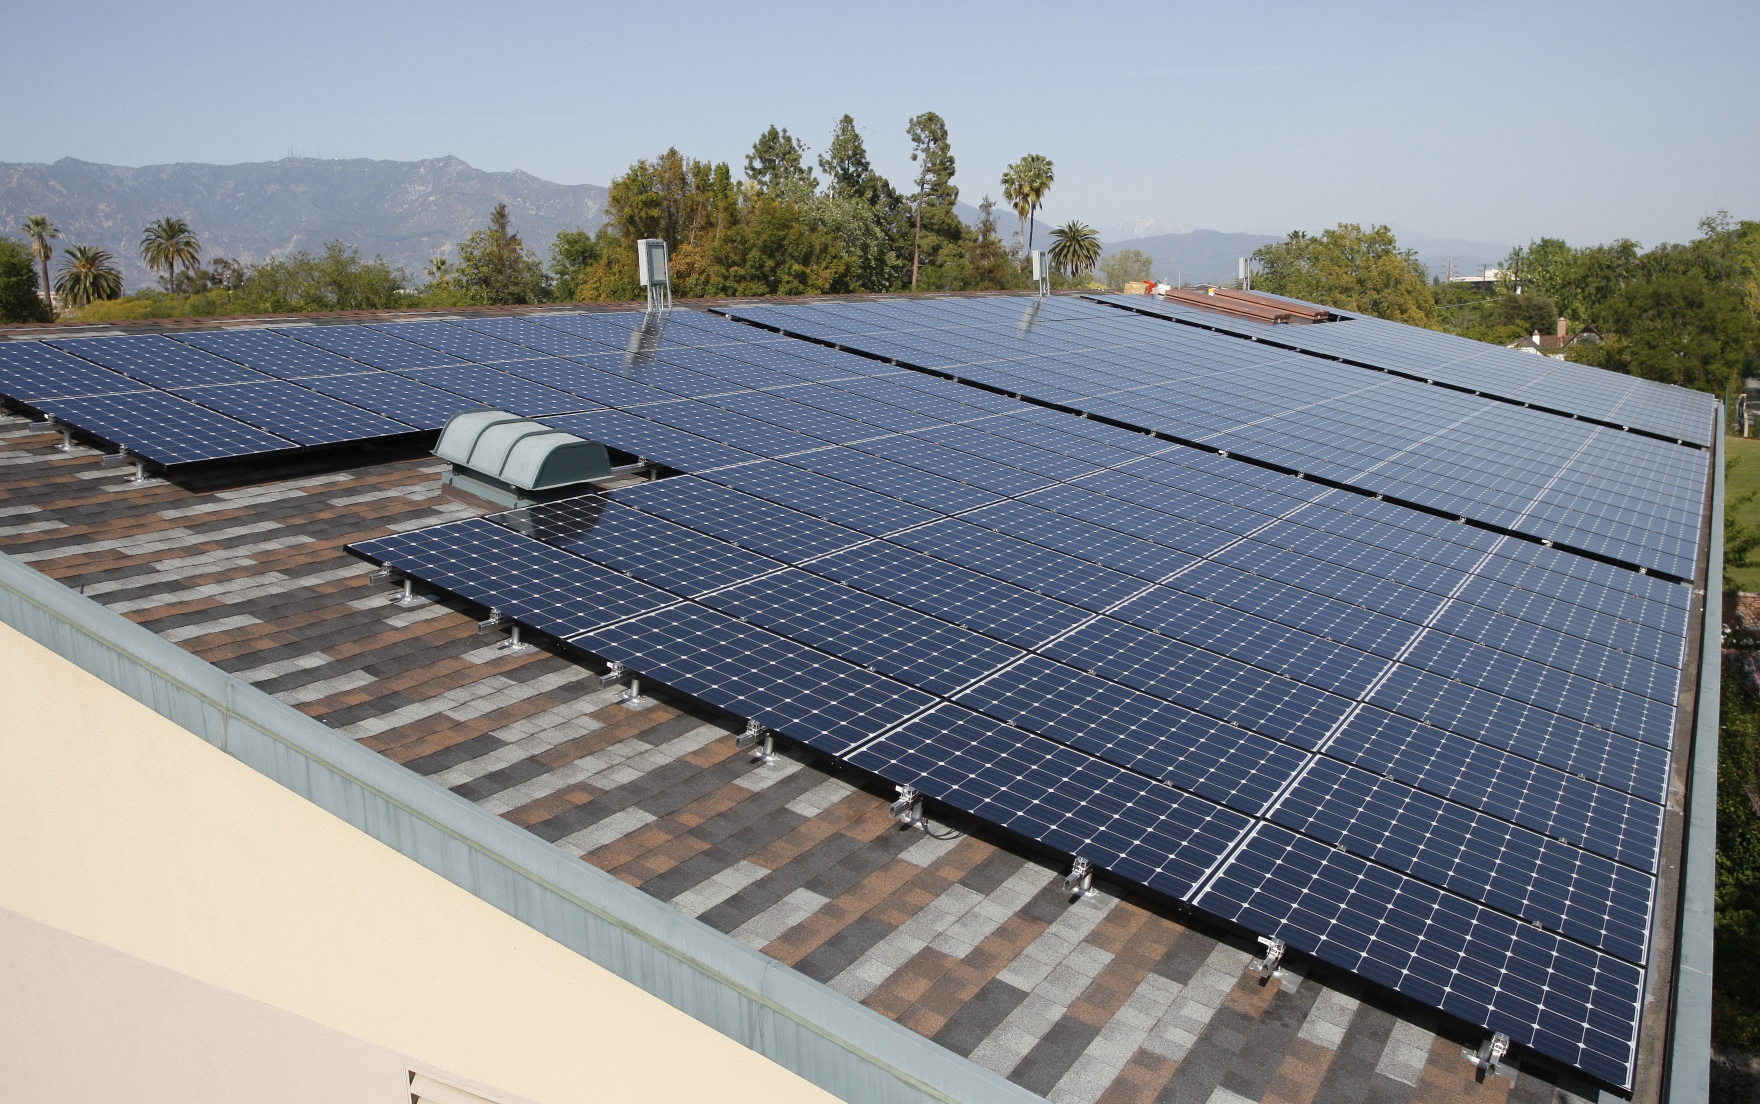
Three inspections later - fire, building & safety, and PWP - and we were ready to officially go live. Here’s how the system appeared on the Enphase Enlighten website one recent sunny day:
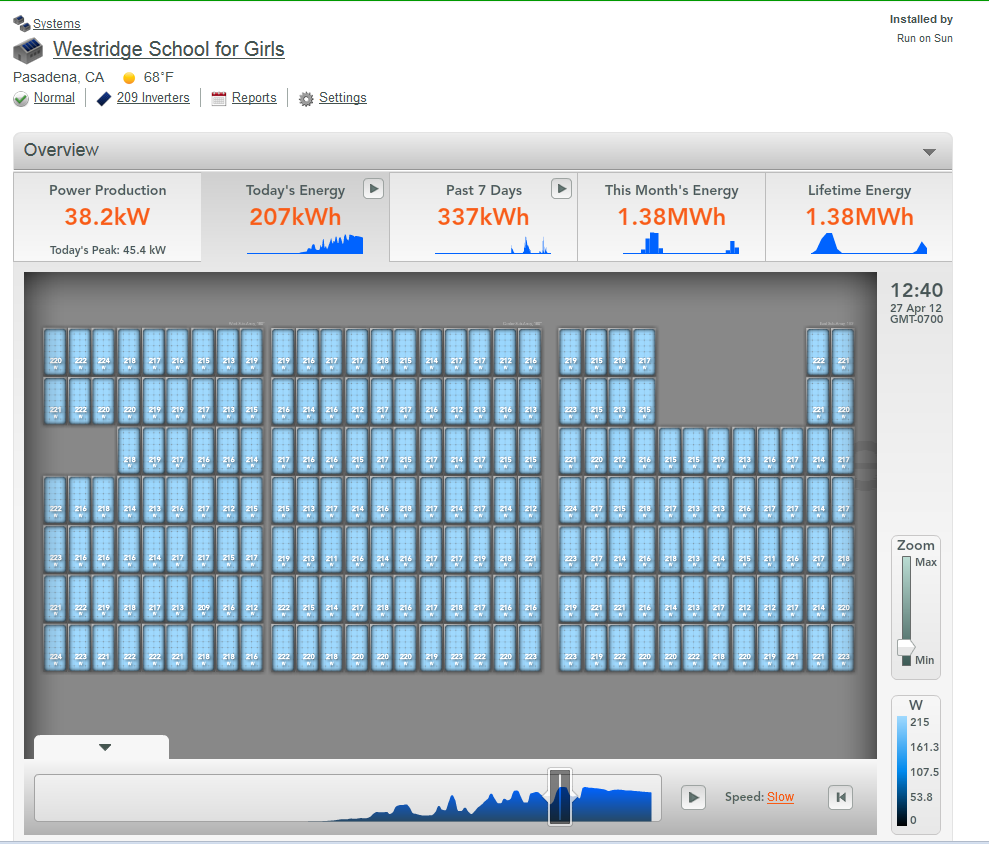
The students at Westridge will be able to analyze the performance of this system for years to come, providing a first hand experience of how renewable energy works and can make a difference in our lives - what a great lesson to learn!
Chapter the Last
Which brings us to the end of this series - almost. In our final installment you will see the video that we have produced for this project and you will hear from the Head of Westridge School, Elizabeth McGregor, Facilities Director Brian Williams, and three wonderful students talk about how this project plays into the larger mission of the school. You won’t want to miss it!
Categories: Commercial Solar, Non-profit solar, Westridge PAC Project
On the Ground - Installing Solar at Westridge - Part 3
In parts 1 and 2 of this series, we documented what went into securing the rebate reservation and the process by which we secured our permits. Now the actual work could begin - and that work starts on the ground. So in this Part 3, we will look at the staging that was required for this production and take a close-up look at some of the heavy lifting that was needed far below the array itself.
A project the size of what we were going to install at Westridge - 52.3kW - involves thousands of parts, all of which not only must go together properly for the system to work and be safe, but they must arrive in a timely fashion! For example, here’s just a sample of the parts that were needed for this job: hundreds of FastFoot plates, thousands of screws, hundreds of flashings, standoffs, and flange connectors, dozens of rail sections, mid-clamps, end-clamps, ground lugs and splices, to say nothing of 209 micro-inverters and solar panels! Collectively these products came from five different distributors in four different states.
Needless to say, not everything goes as smoothly as you might like when you are pulling together all of these pieces. UPS likes to brag about Logistics, but we found some of their logistics to be highly illogical. Such as their sending two shipments that were sitting in an LA warehouse on a frolic and detour down to San Diego for the weekend, instead of driving them the twelve miles up the road to our job site!
 Equally baffling were the folks who delivered our boom lift to the job site late on a Friday evening without even a phone call and just parked it out on the street - in front of a No Parking sign!
Seriously…
Would you leave this…
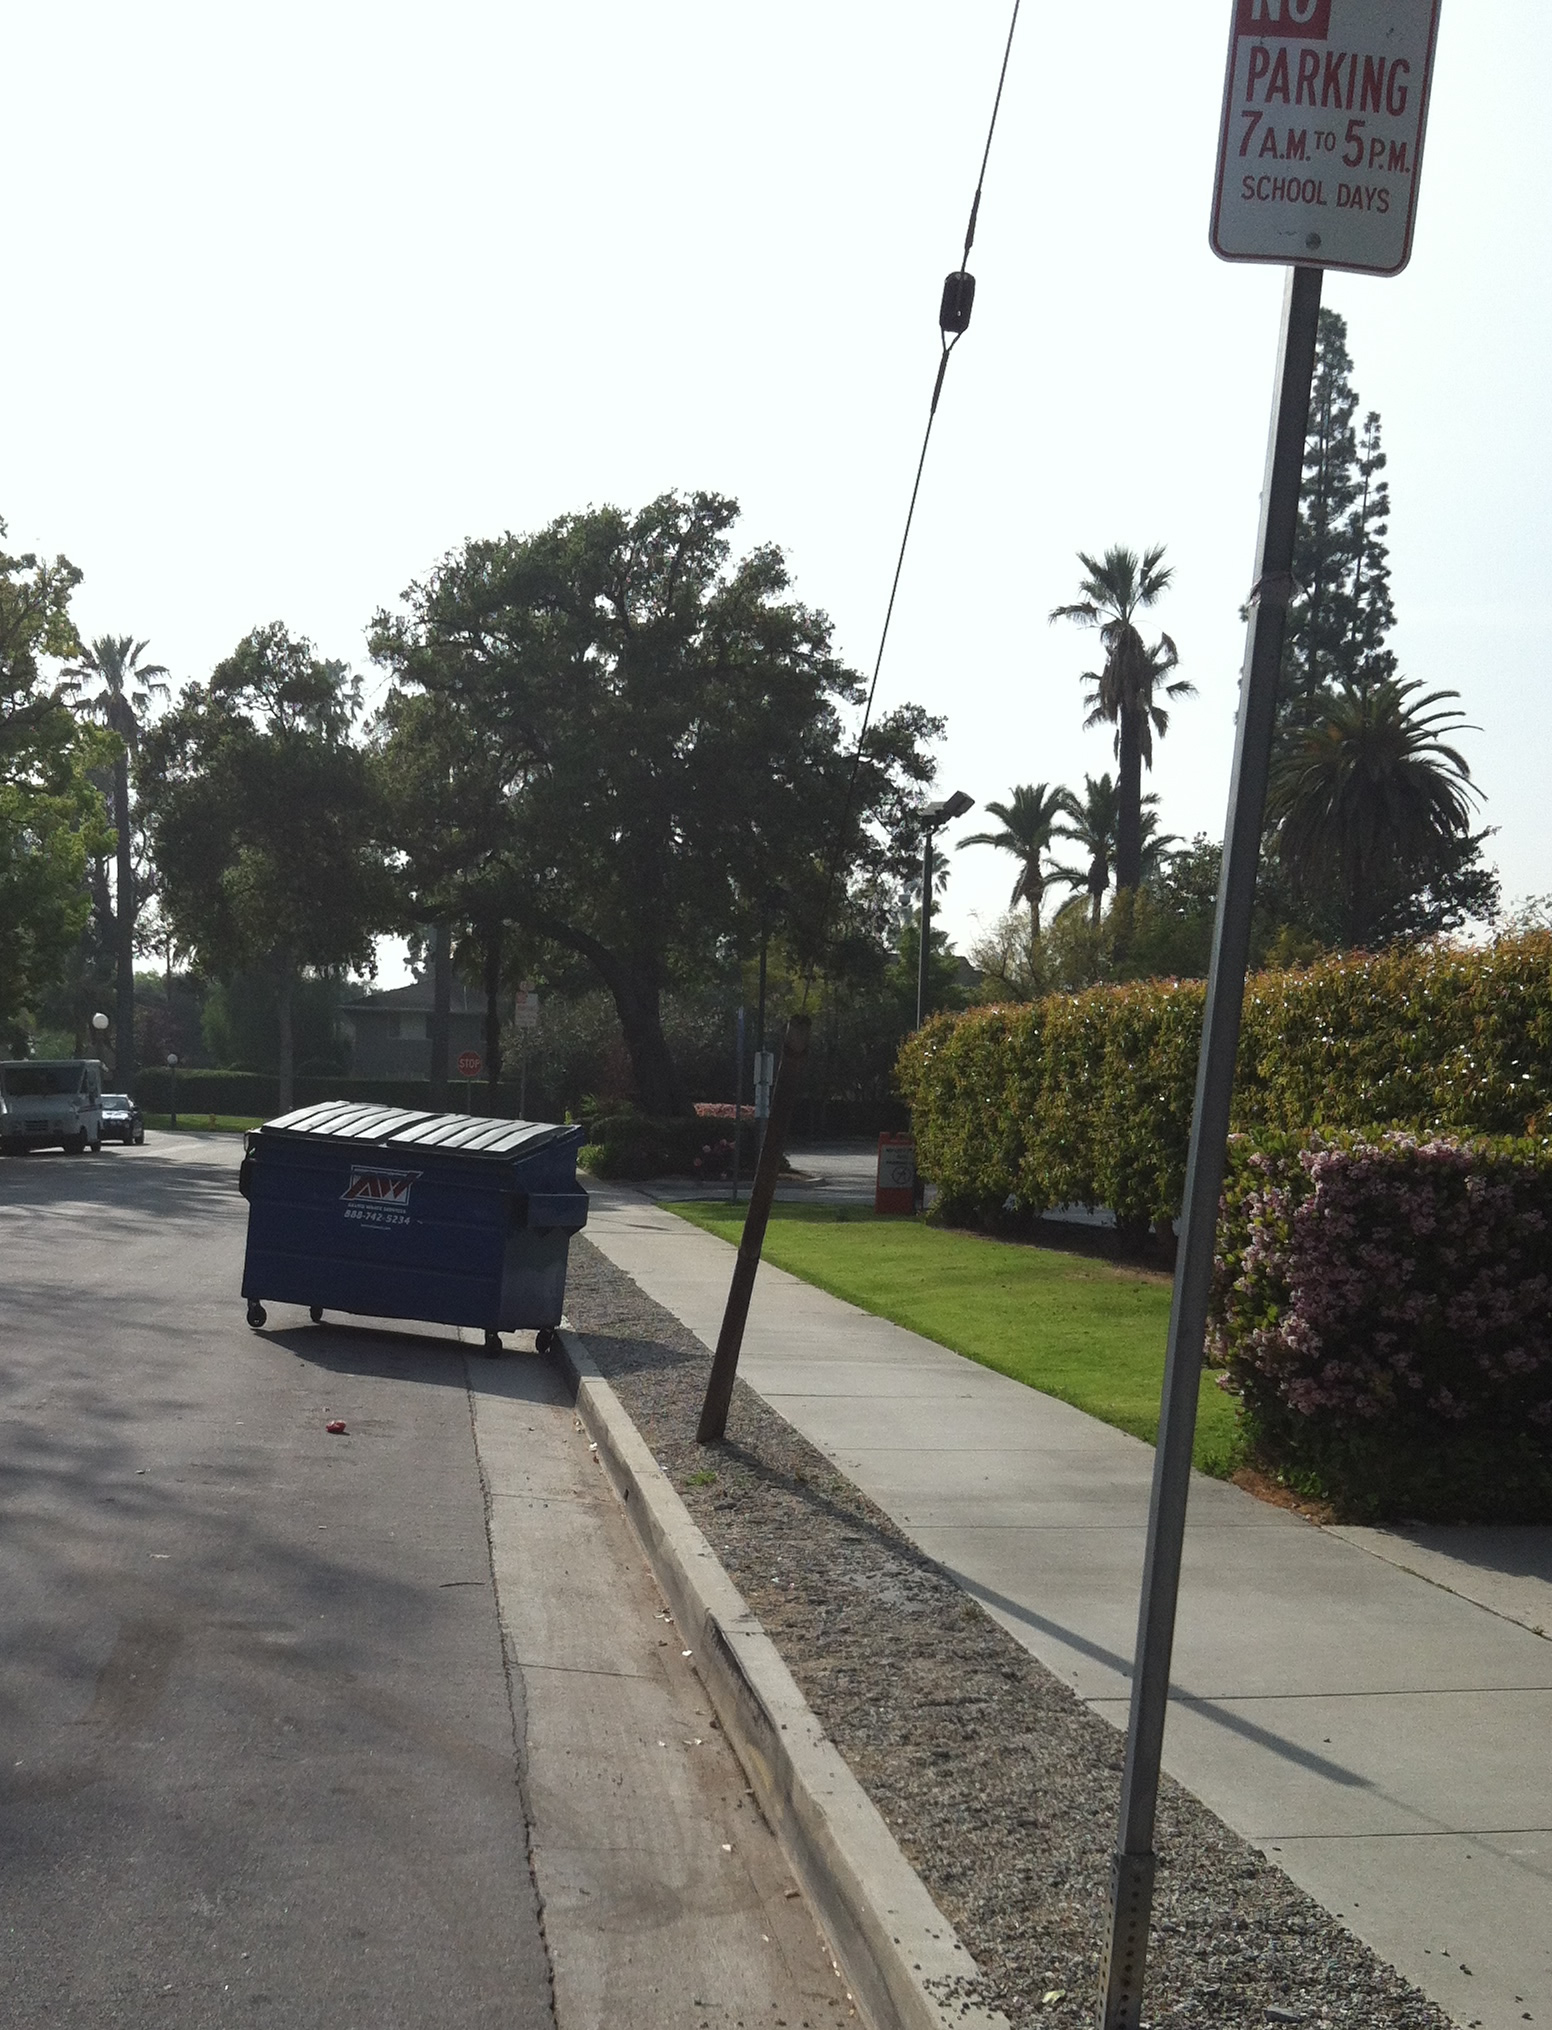
Here? Right - neither would we! (And yes, the keys were in it!) The unscripted appearance of our boom lift prompted a puzzled call from the facilies director at Westridge:
Brian: “Were you folks expecting a boom lift to be delivered?”
RoS: “Yes, they are delivering it tomorrow morning.”
Brian: “Well, it’s here - and they left it on the street next to a No Parking sign.”
RoS: (Eek!) - “Really? We’ll be right there!”
Like I said, not everything can go exactly as planned, but soon enough, everything arrived and in good condition.
Our staging area was set with:
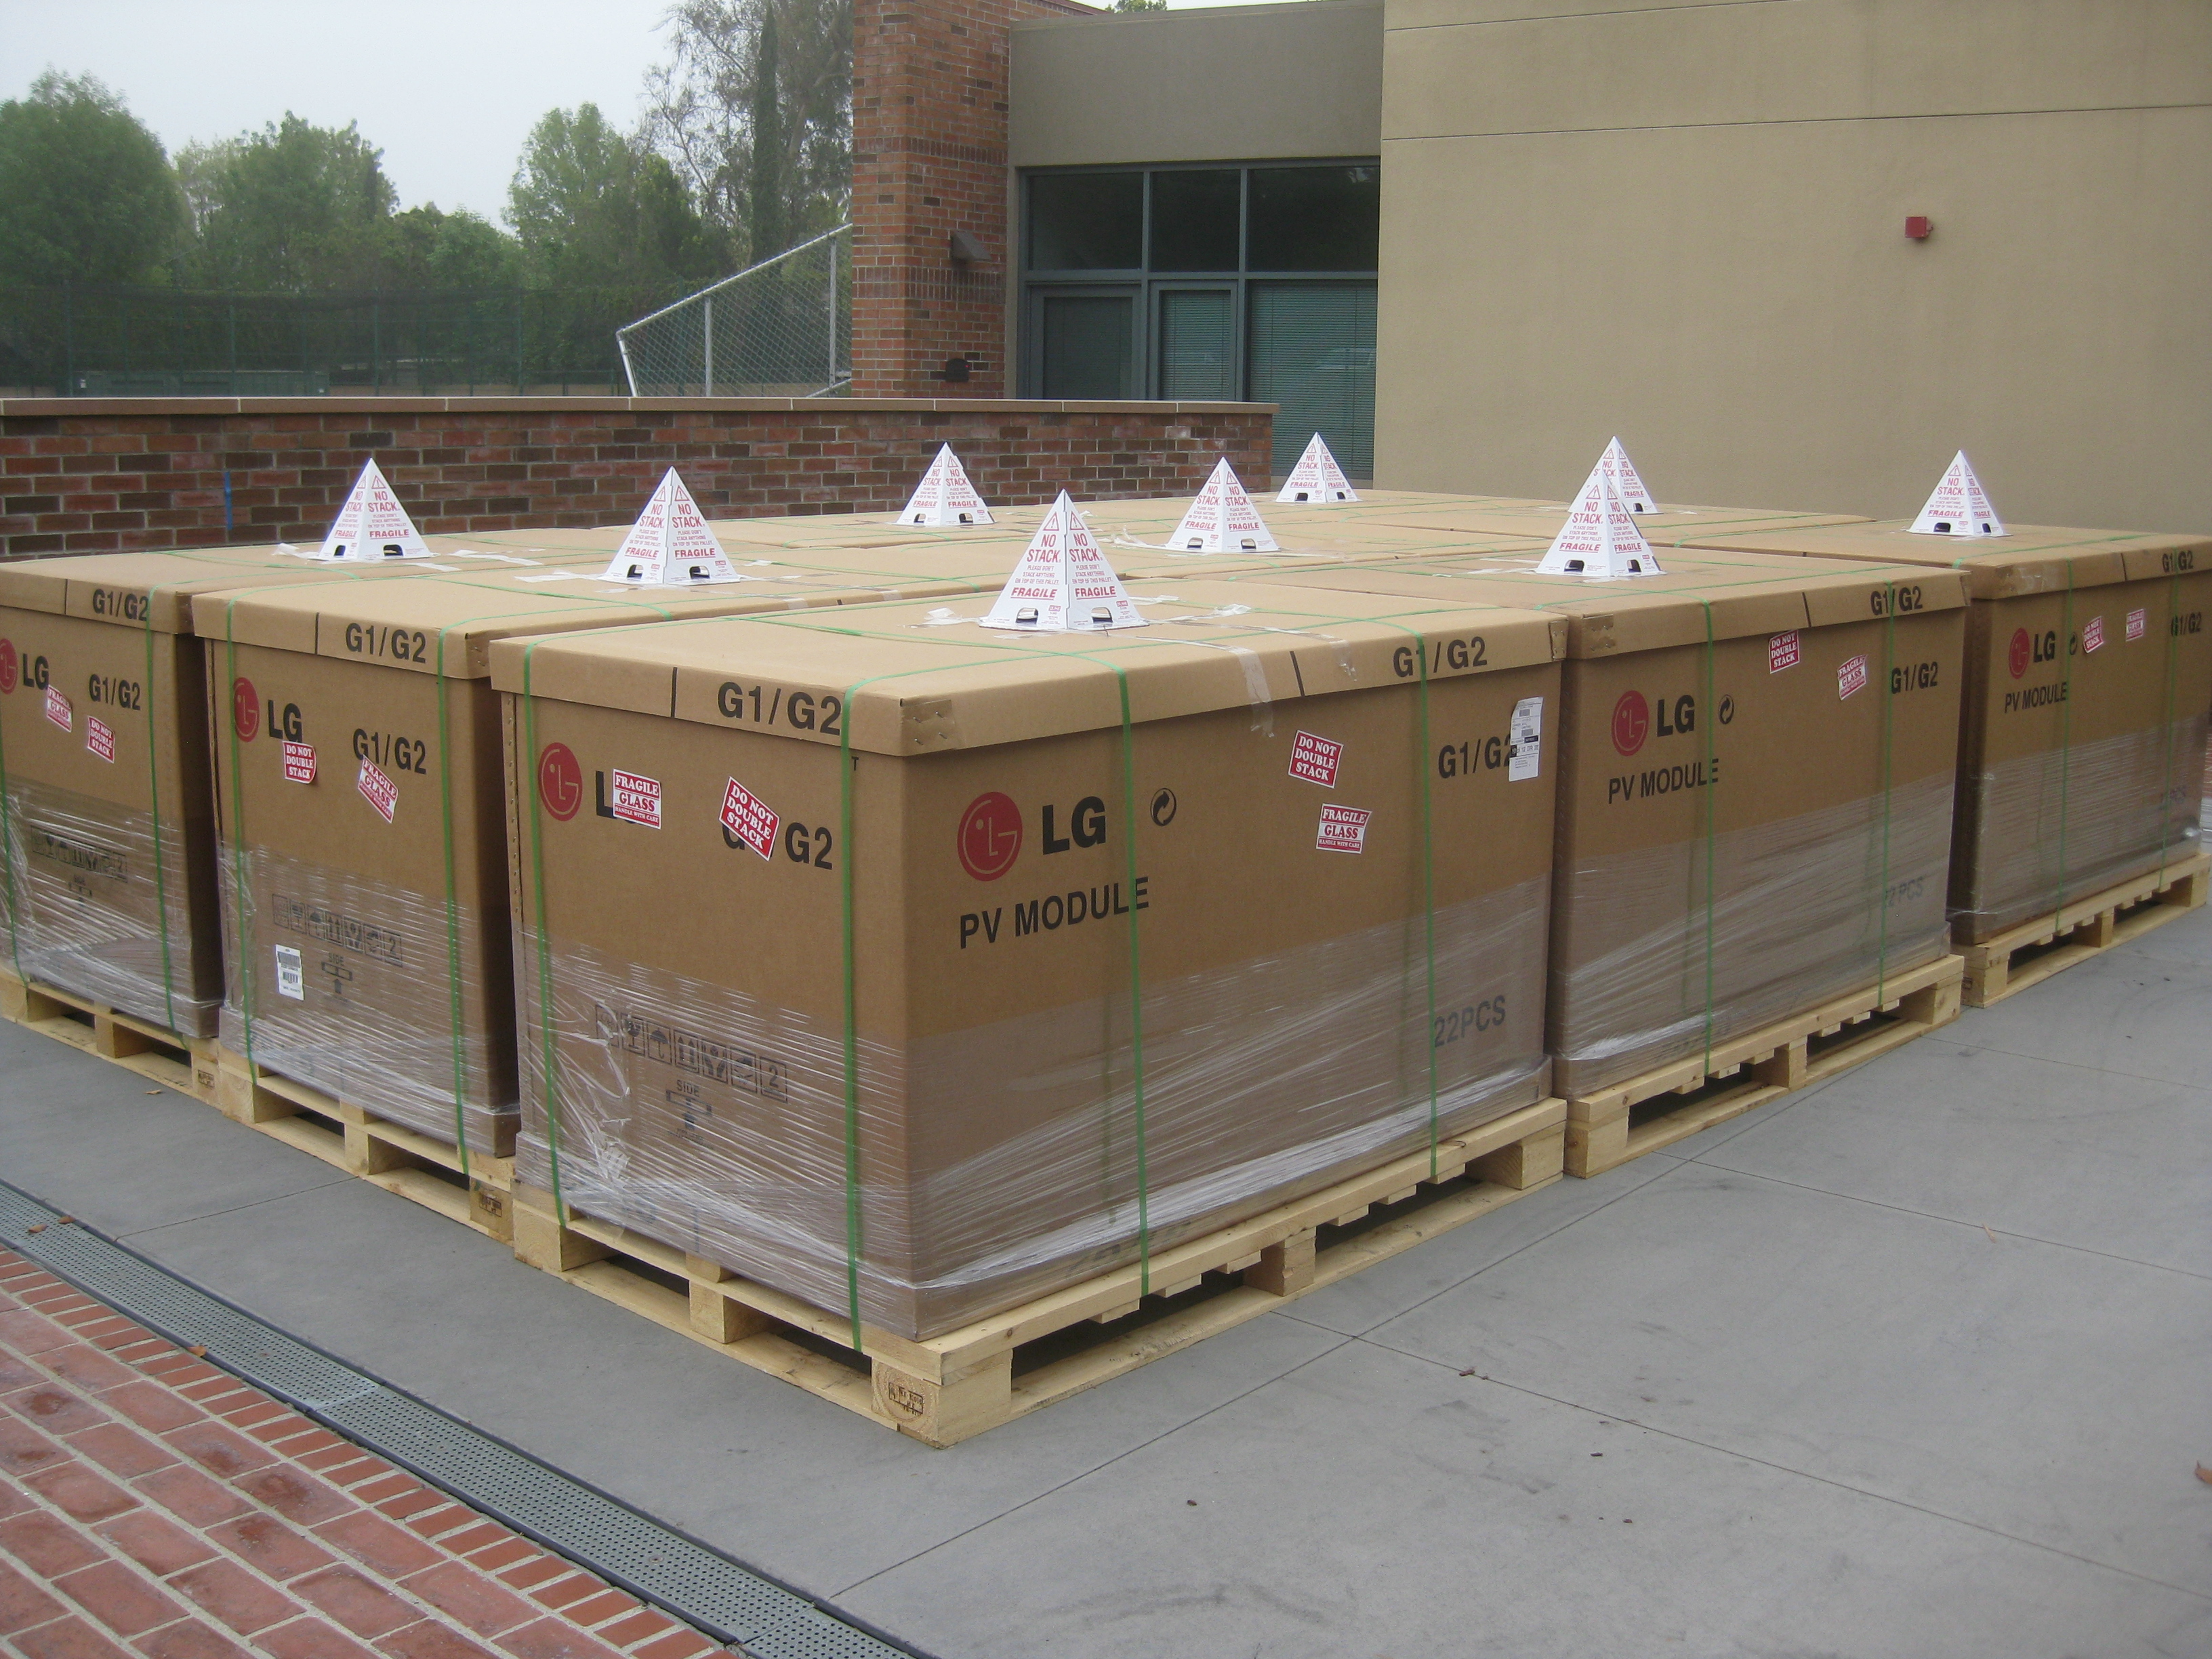
LG Solar Panels
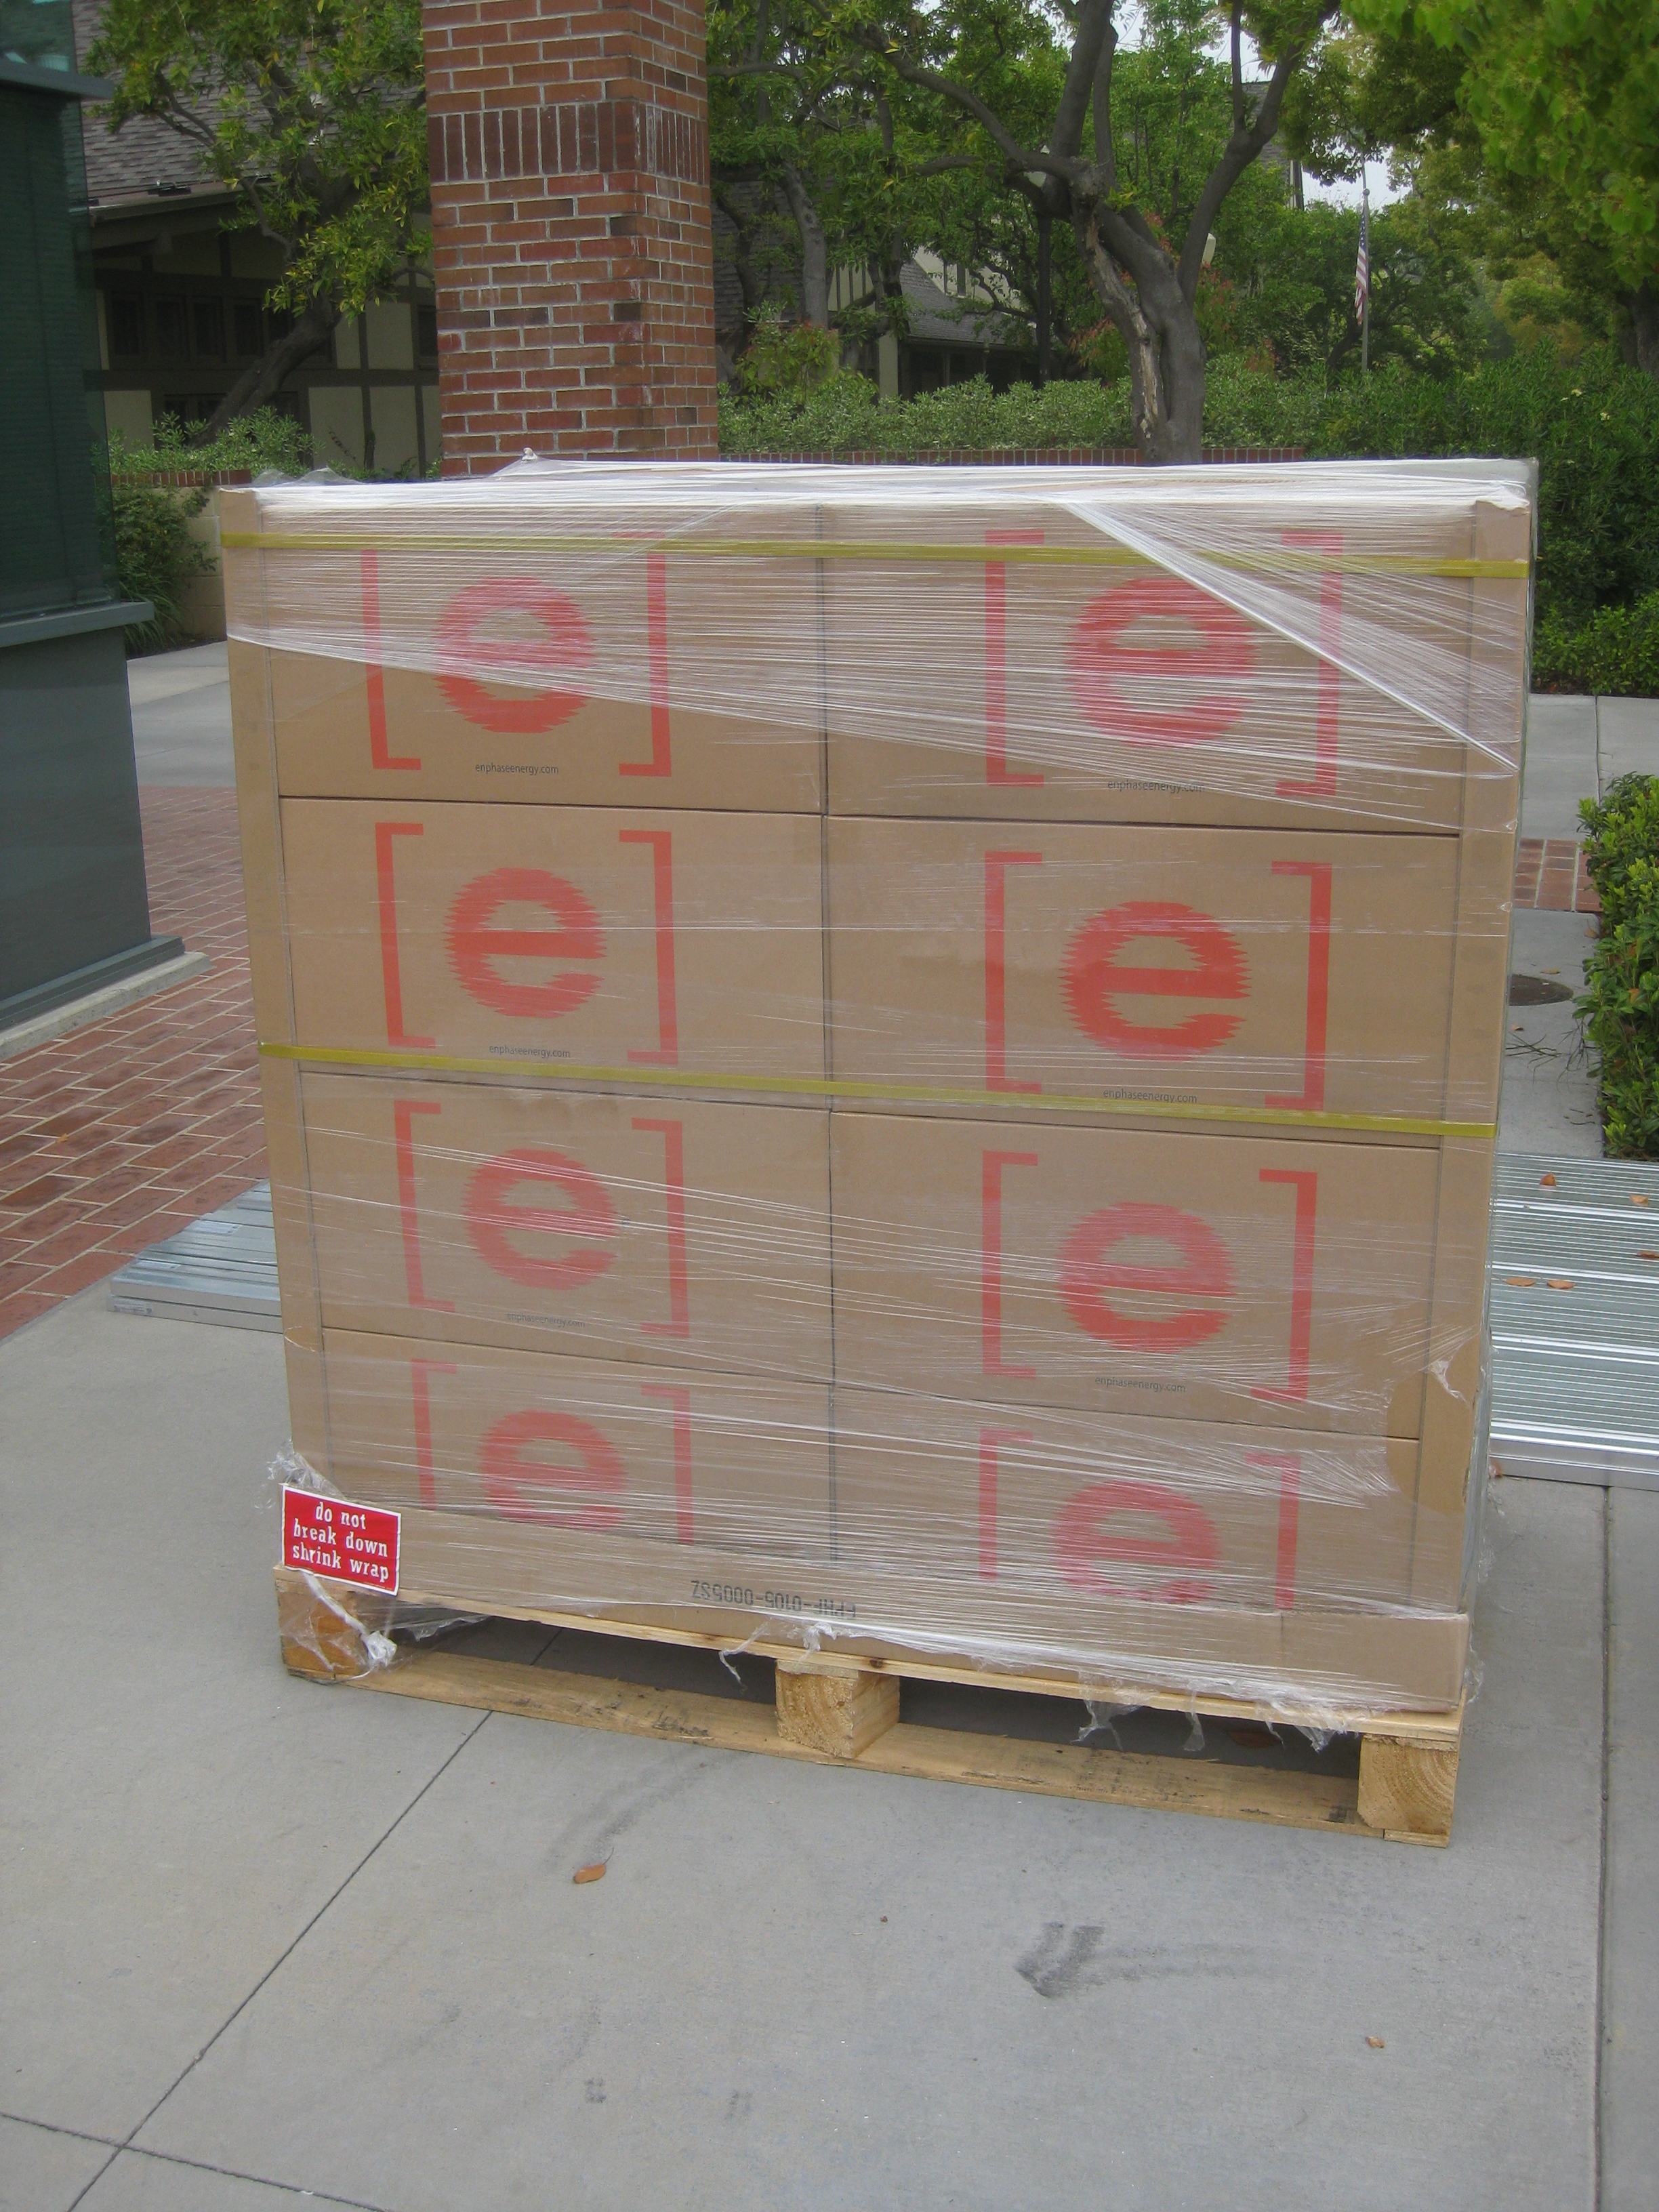
Enphase Micro-inverters
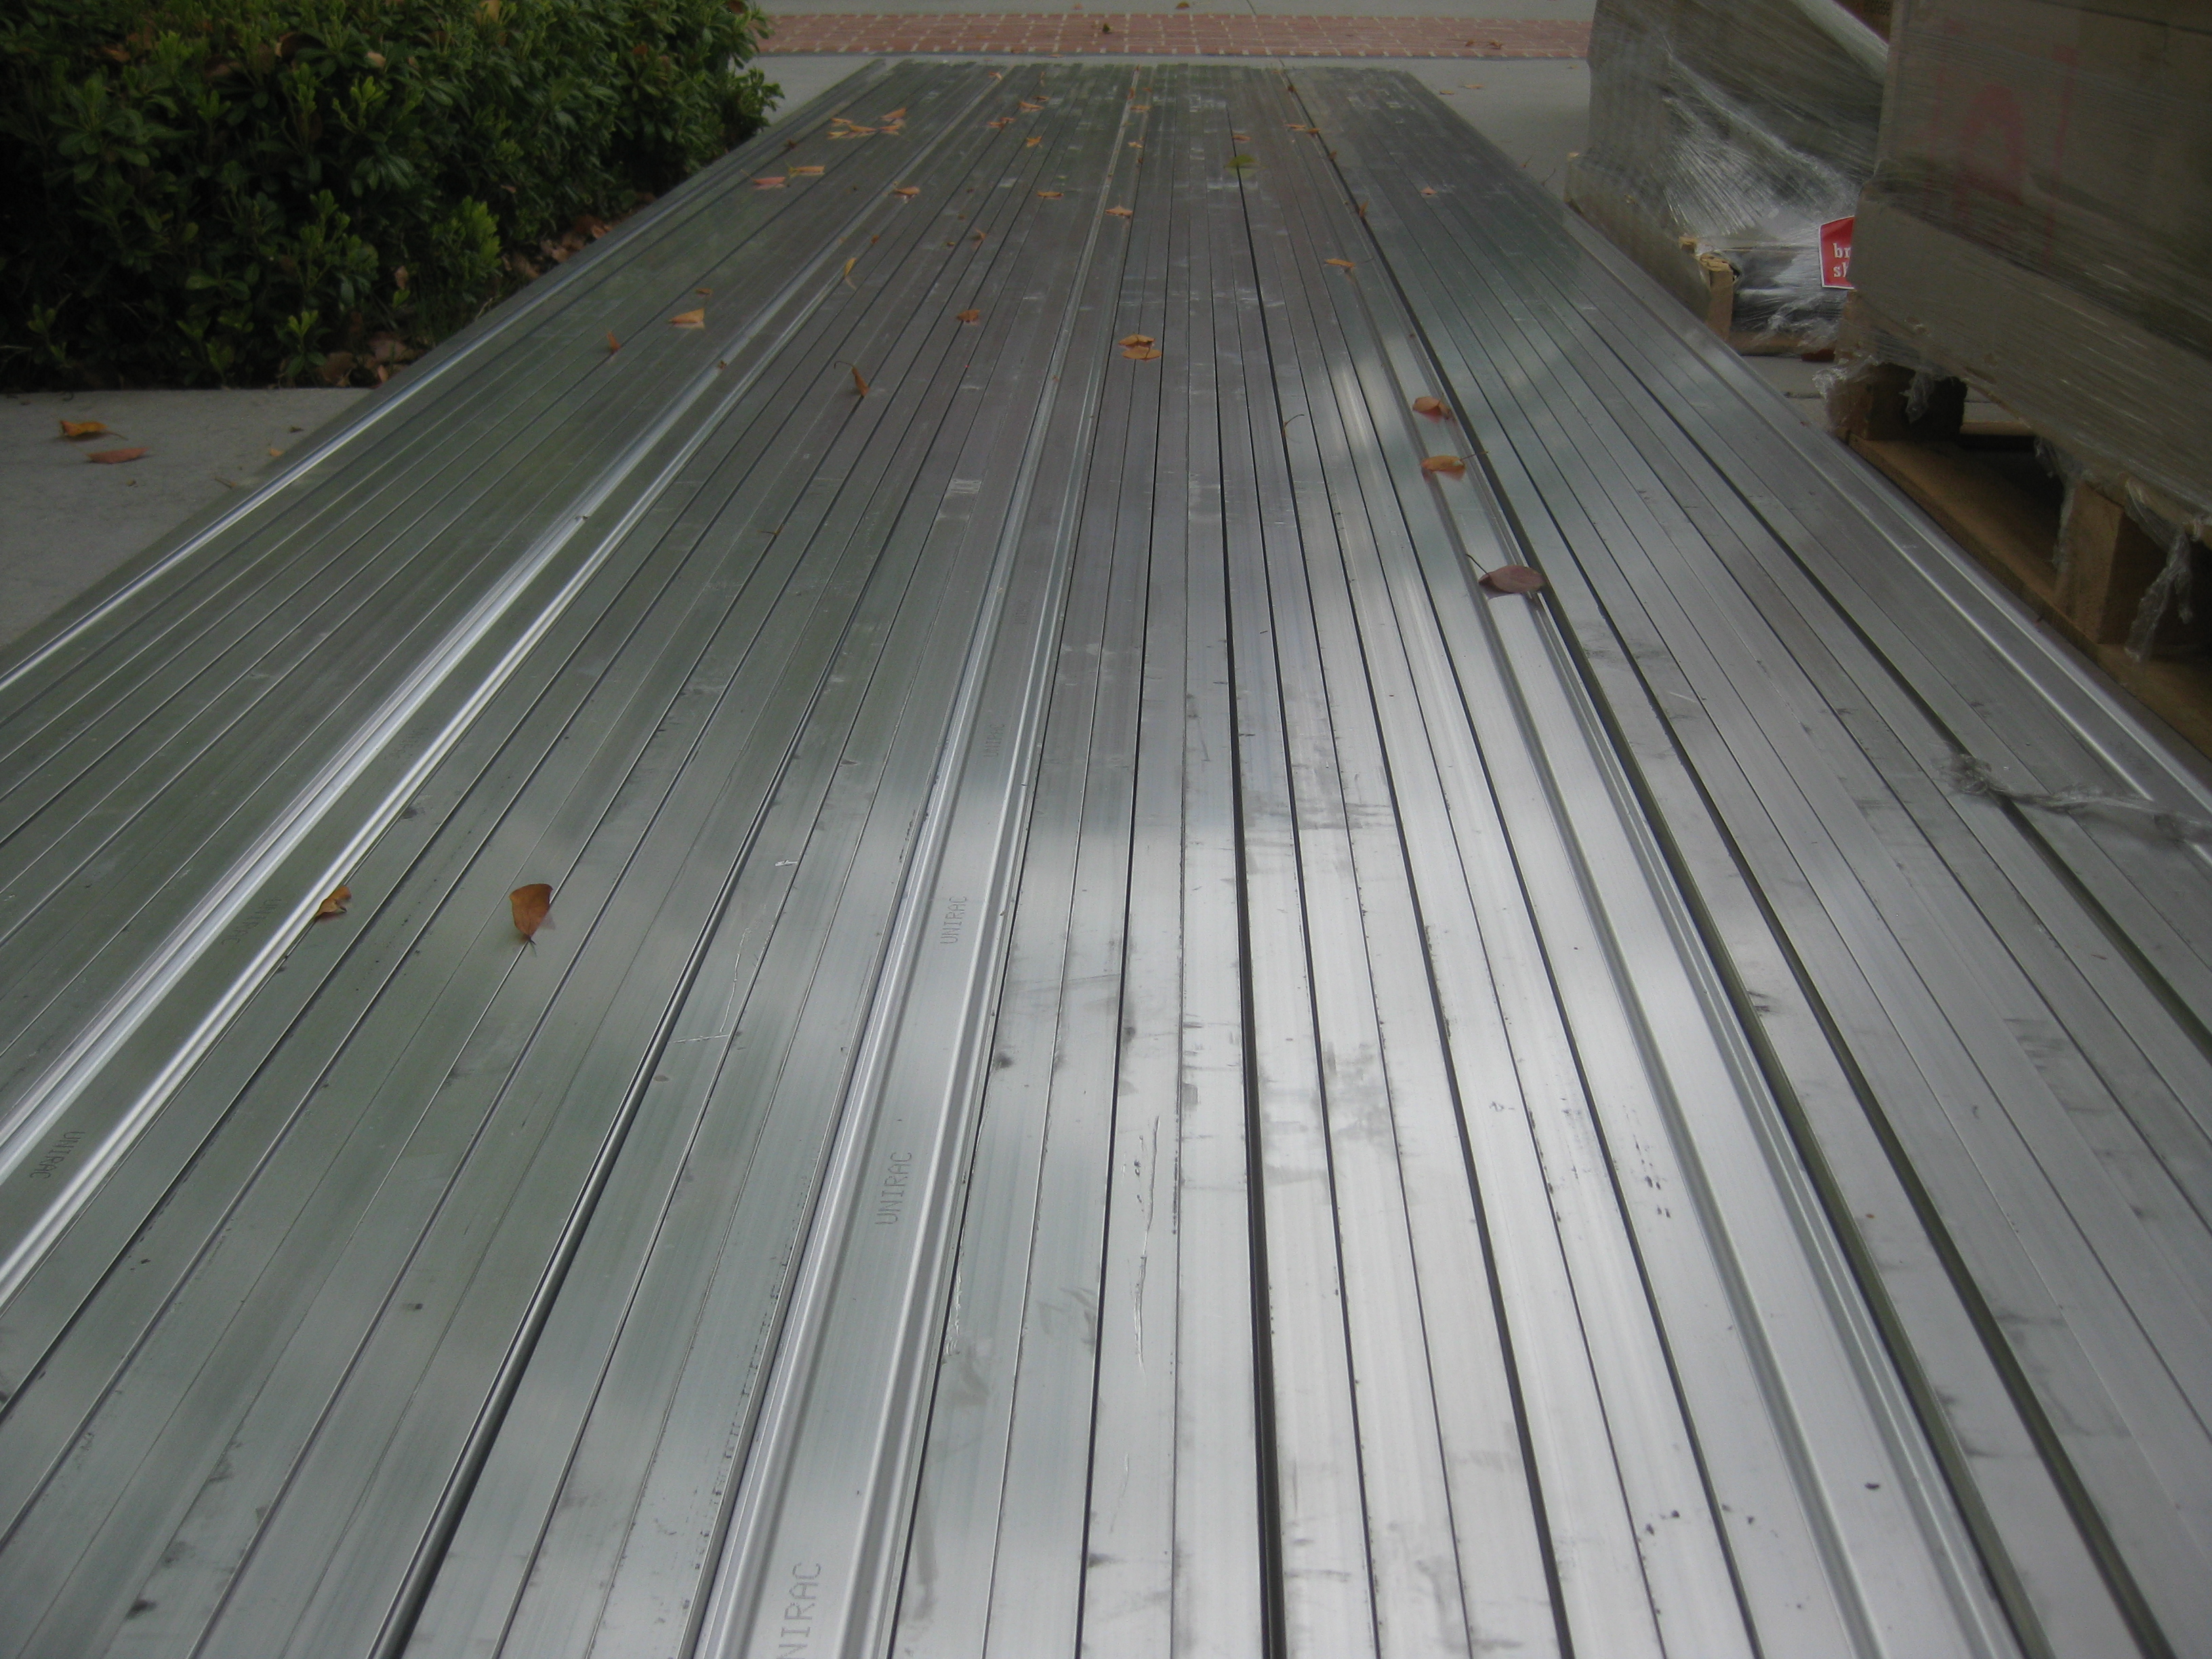
Unirac Solarmount (Evolution) racking parts
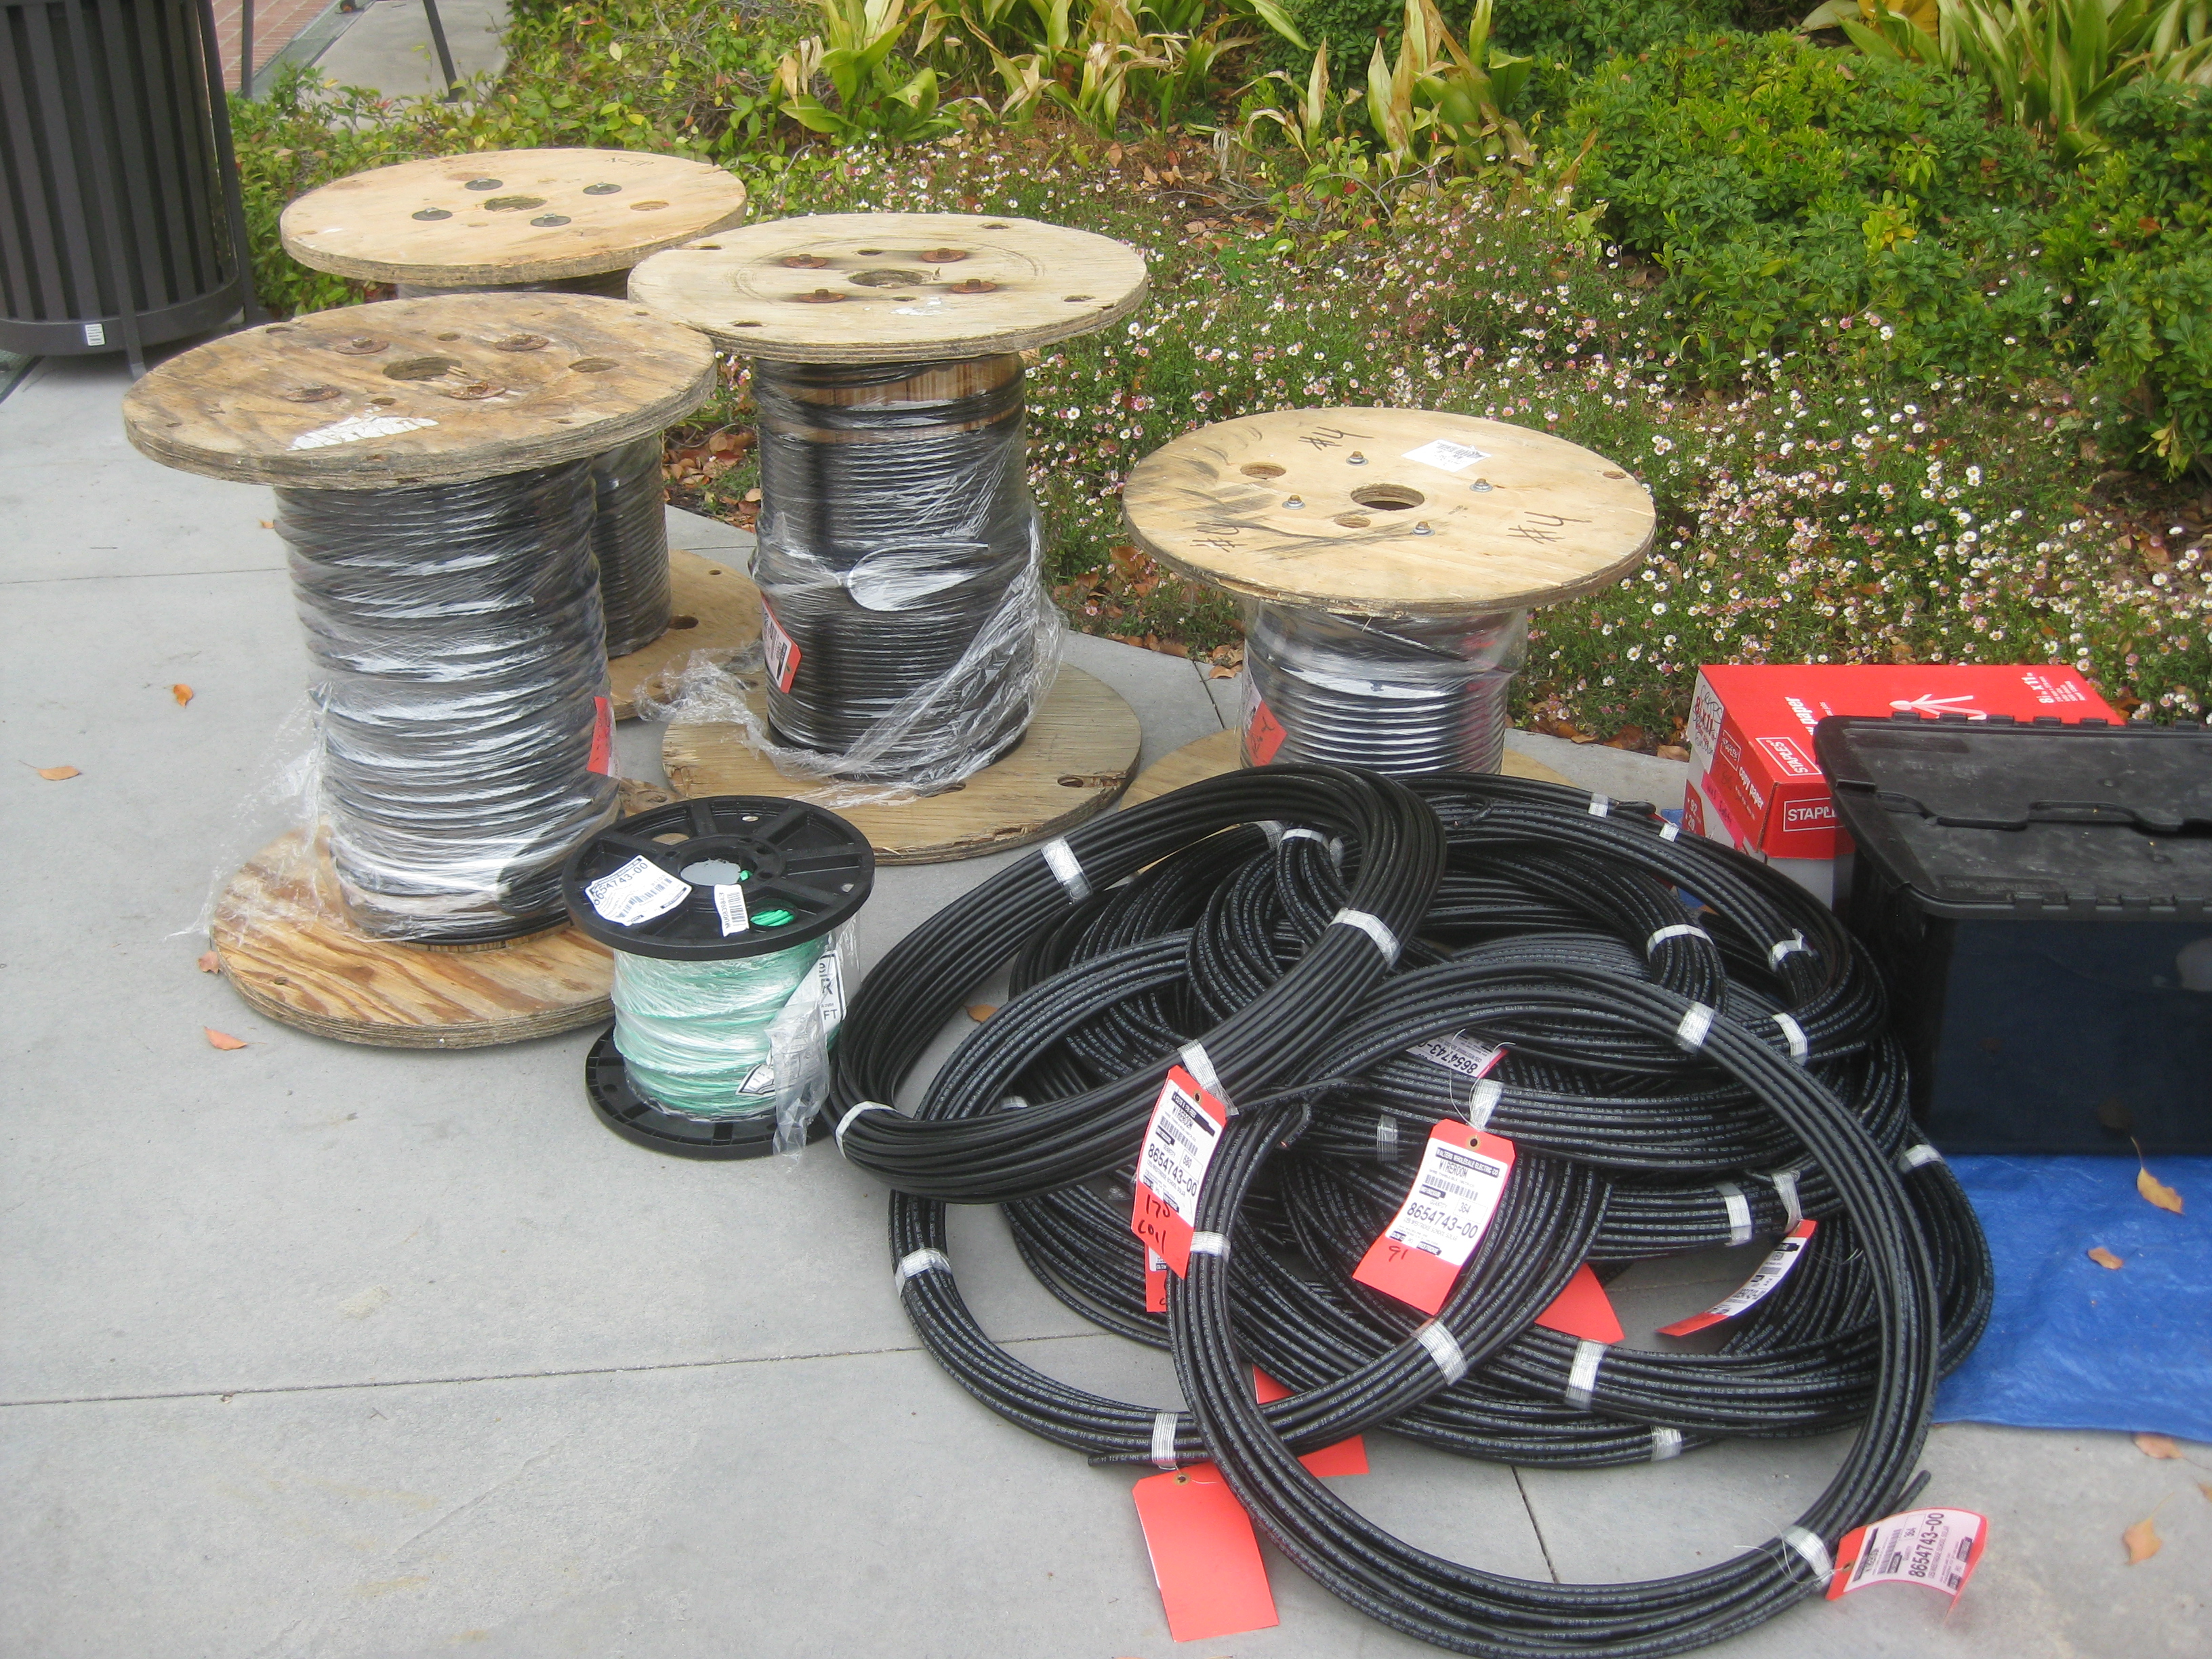
And lots of wire!
Transformation
Our first main task on the ground, now that everything was at hand, was to install our transformer. This project required a transformer to step-down the voltage from the utility service (480 volts, three-phase) to the voltage that would be used by our micro-inverters (208 volts, three-phase).
Setting the Stage
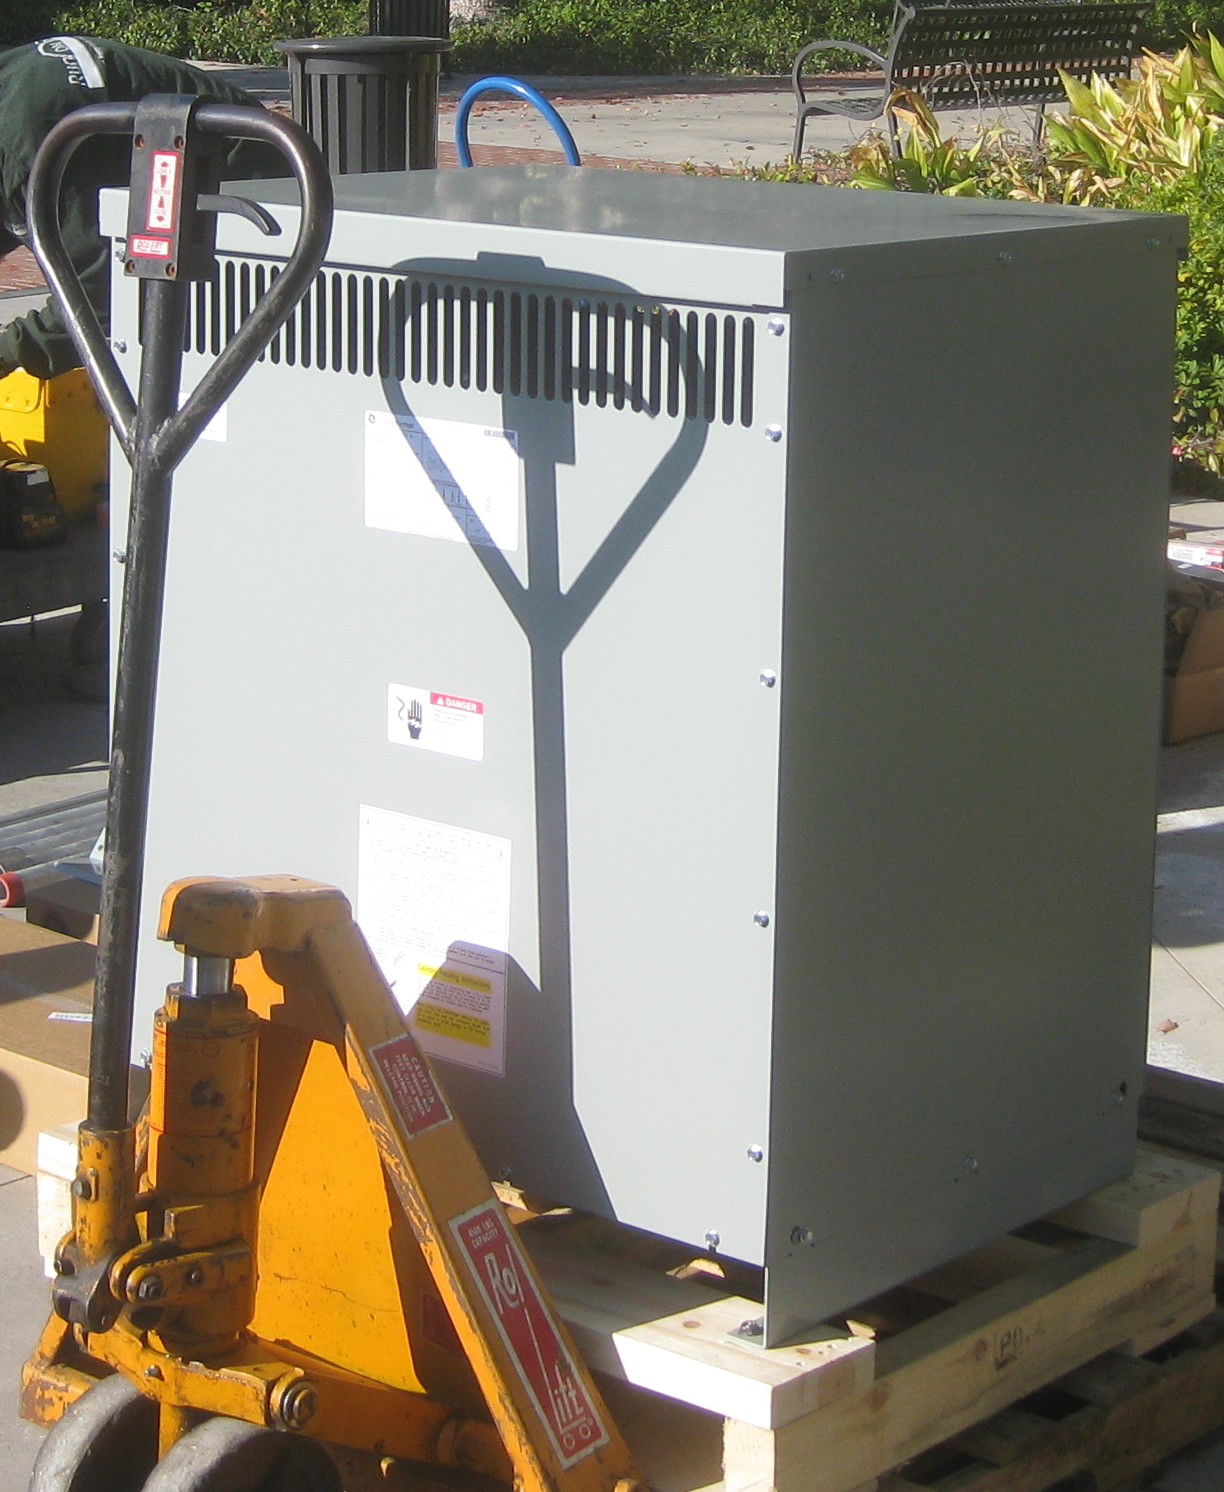 Our transformer was a 700 lb beast that had to be installed on a concrete pad (that we had to pour) in the equipment storage area on the East side of the building. To secure the transformer to the pad, we would imbed bolts into the pad and then maneurver the transformer on top of the bolts and anchor it with washers and nuts. Two key challenges there - first was to guarantee that our bolts were precisely positioned in the pad since the transformer gave us very little margin for error. Second was to get the transformer in place on top of the bolts without damaging them.
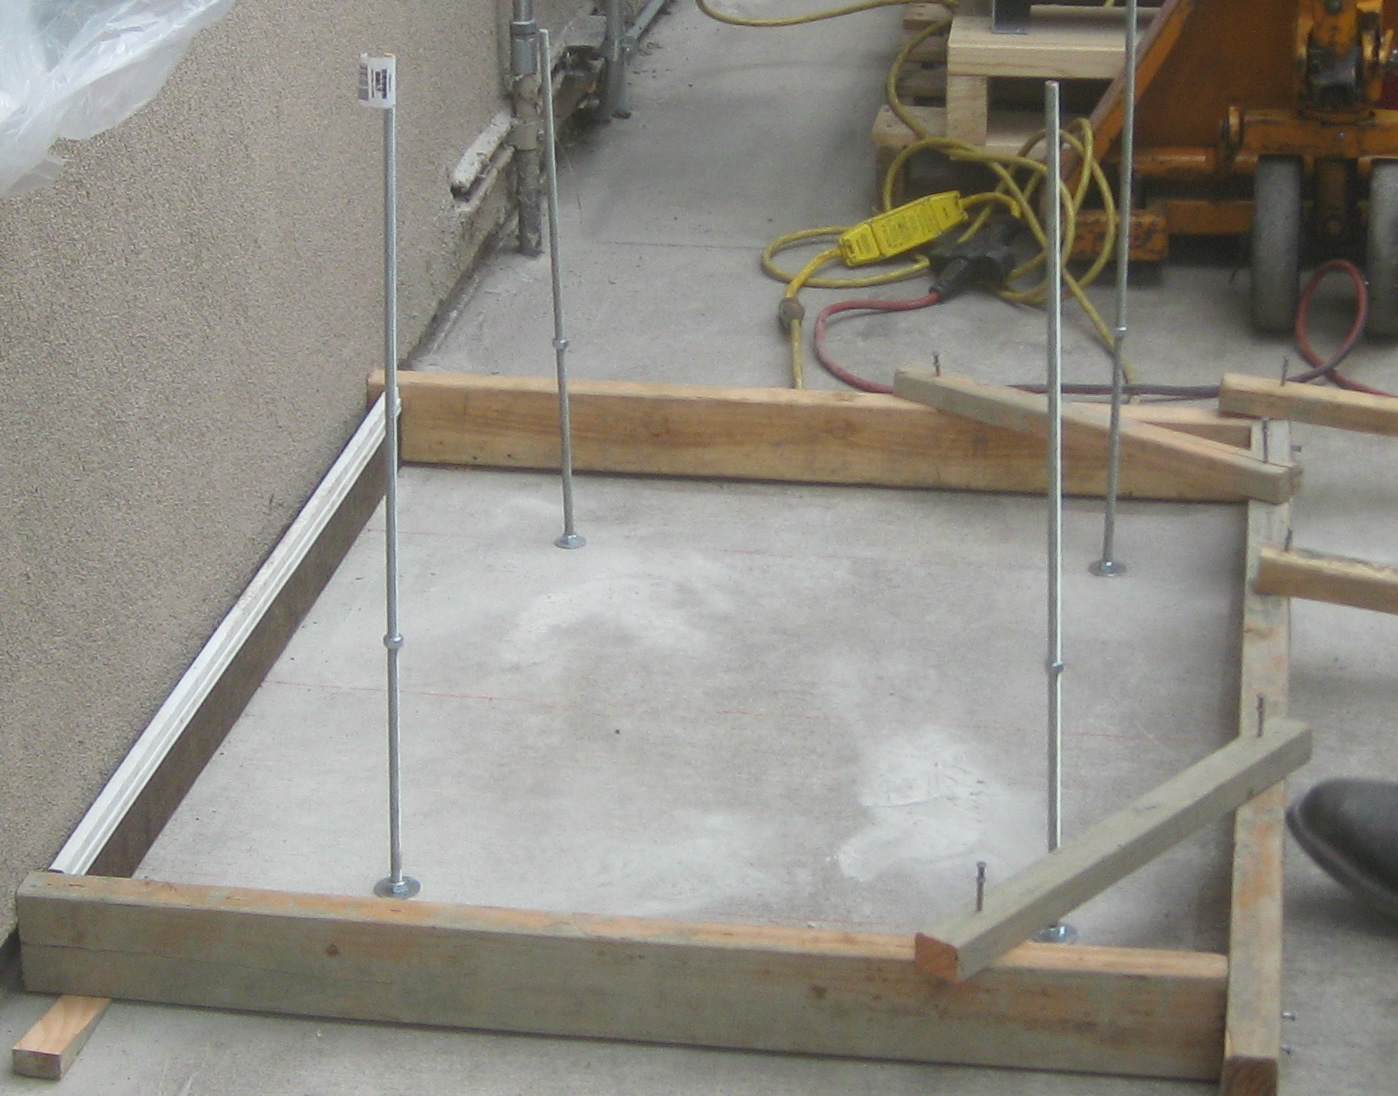 We solved the first problem by drilling into the existing concrete and securing our bolts into the ground with heavy duty anchors - as you see here with the framework for the pad surrounding them.
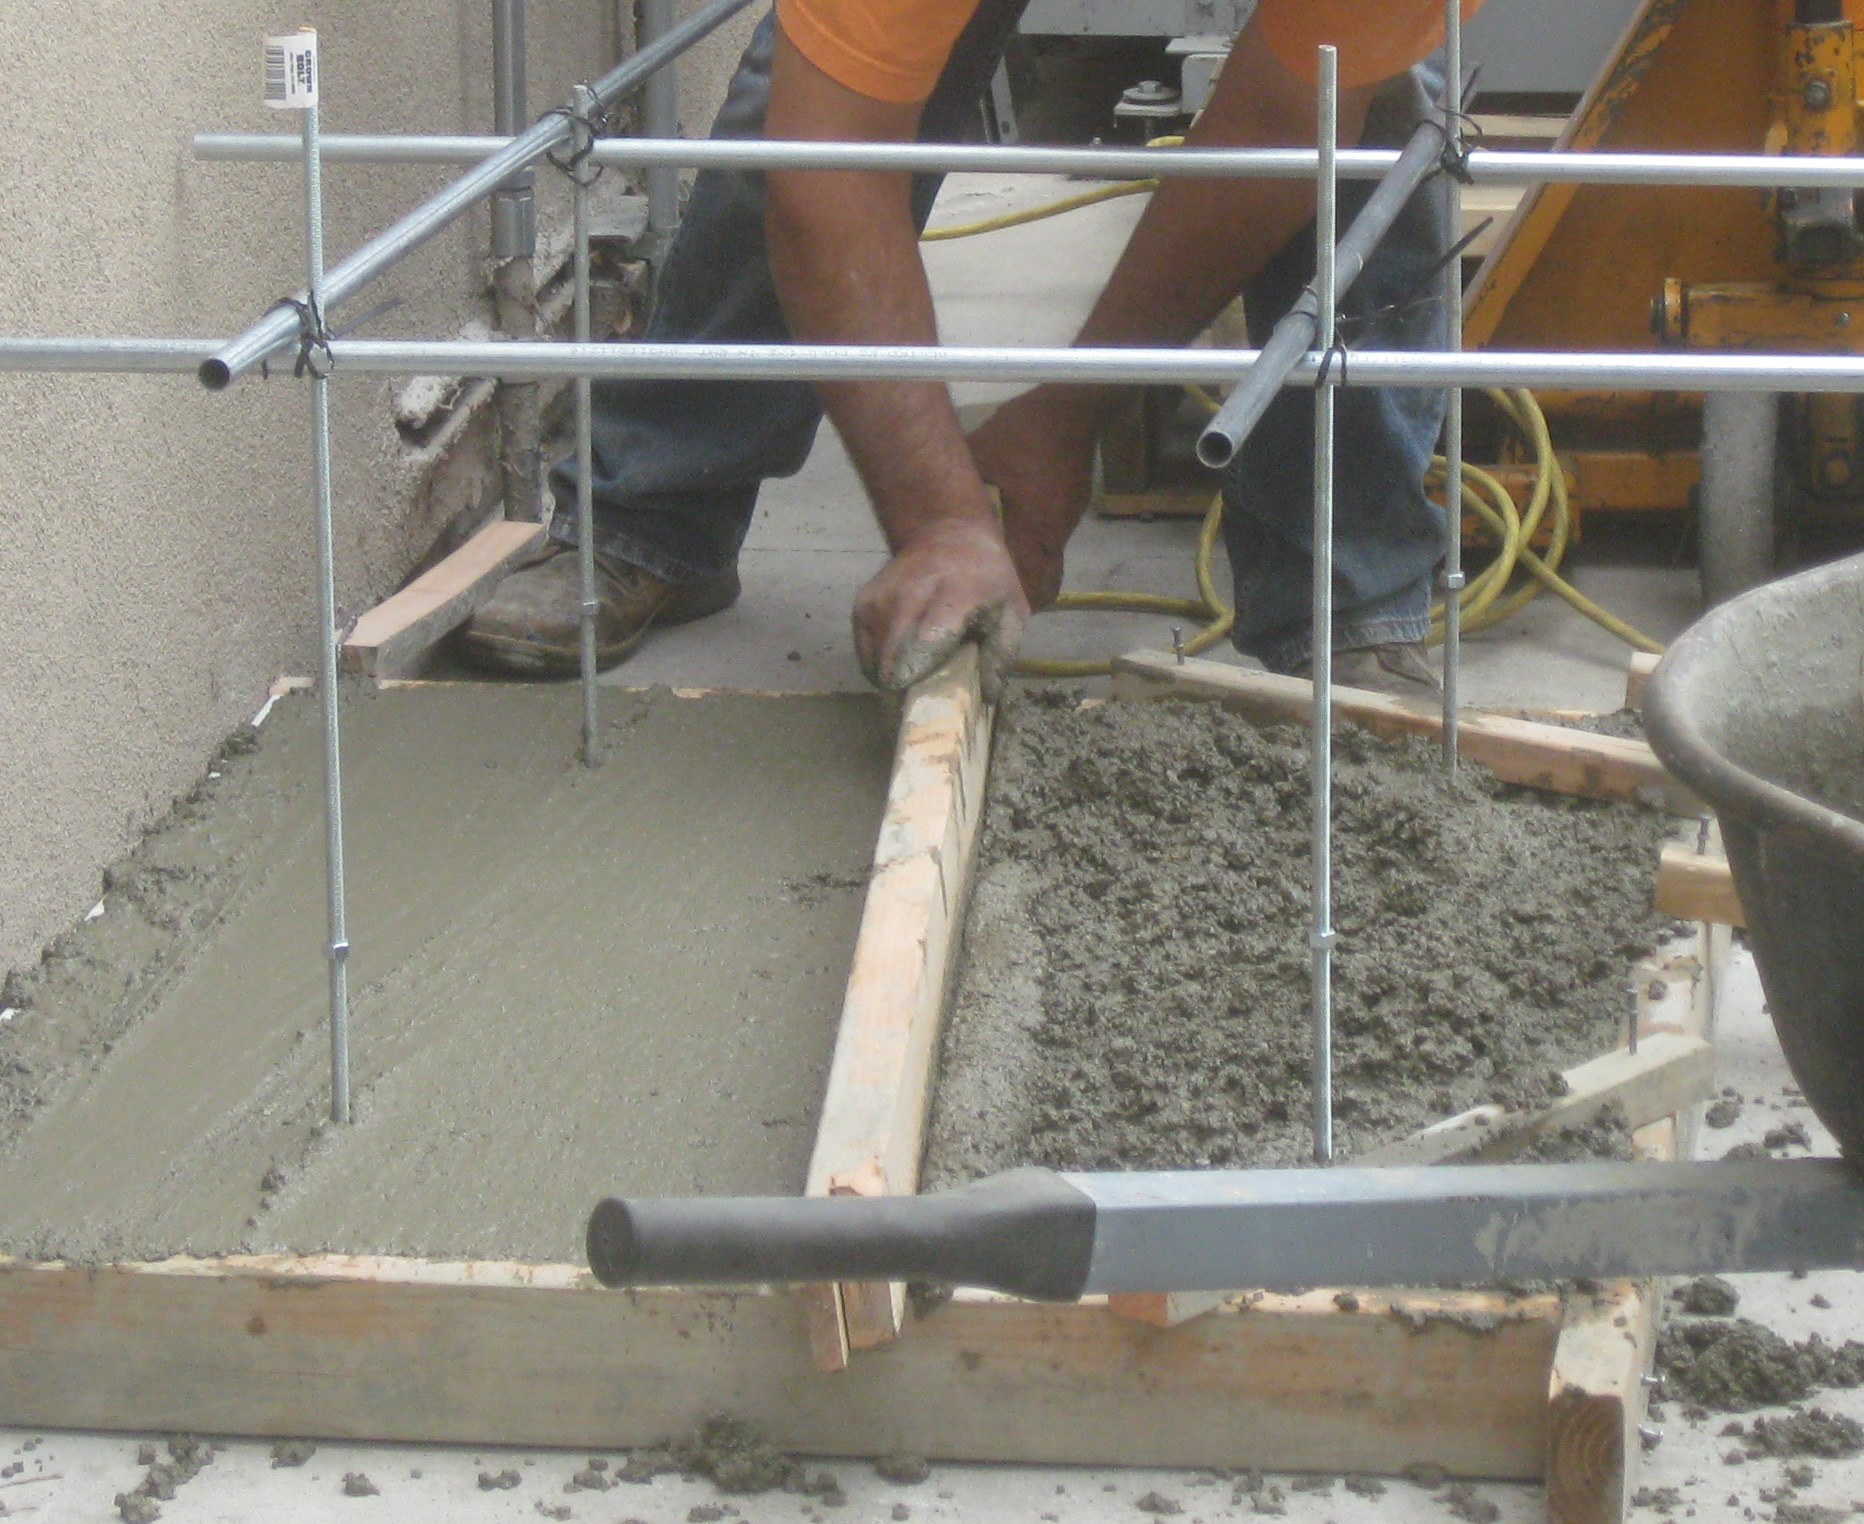
Then, when we were ready to fill in the form with concrete, we added some framing at the top to try and keep the bolts as plumb as possible, as you see here:
The Big (Not So) Easy
That took care of problem number one, but what to do about problem number two? Now that the pad was dry, the challenge became getting our transformer into place.

Our solution would make any student of ancient cultures proud - we crafted a wooden platform over the pad and slid the transformer from its pallet onto the platform. Then we lifted each edge, one at a time, and placed blocks of wood under each corner. That allowed us to remove the platform and then begin lowering the transformer over the bolts by carefully removing a block at each corner.
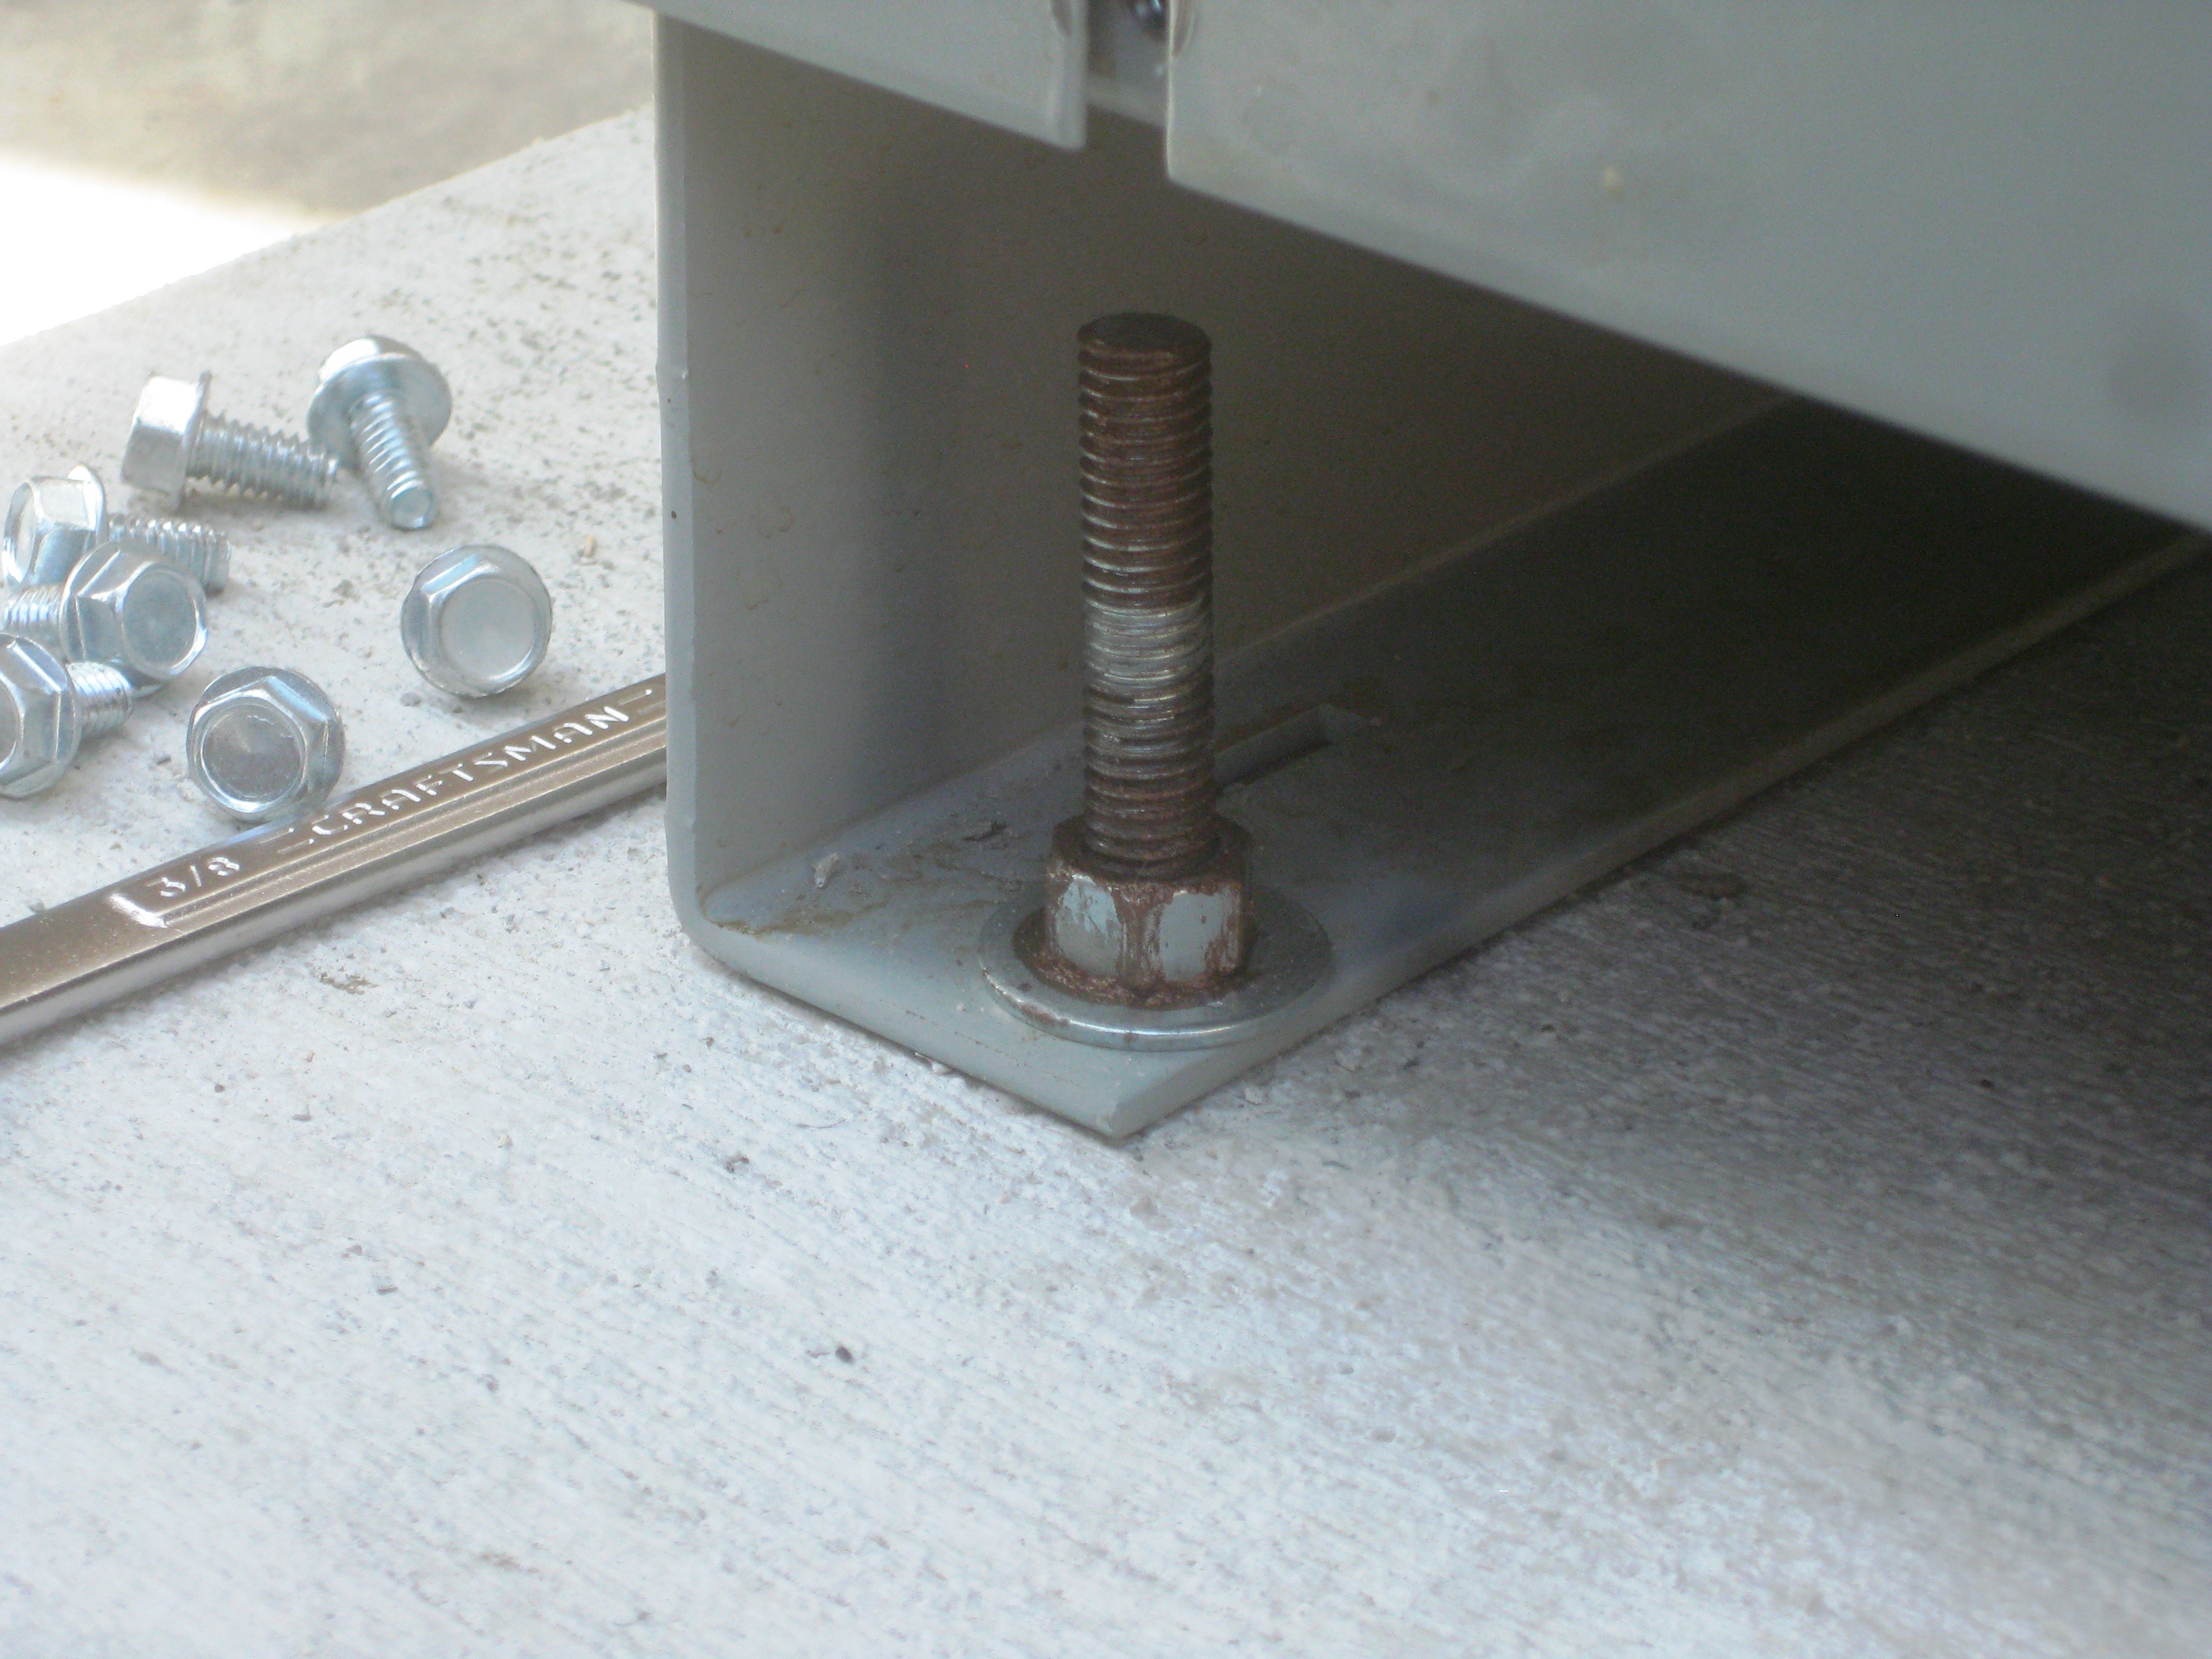 As we removed each block, the transformer came closer to the bolts protruding from the pad. We could push the transformer - gently - so that it aligned with the bolts. Ultimately, the last block was removed and the result was a complete success with just the right amount of angst along the way!
But as you can see, we really didn’t have much margin for error!
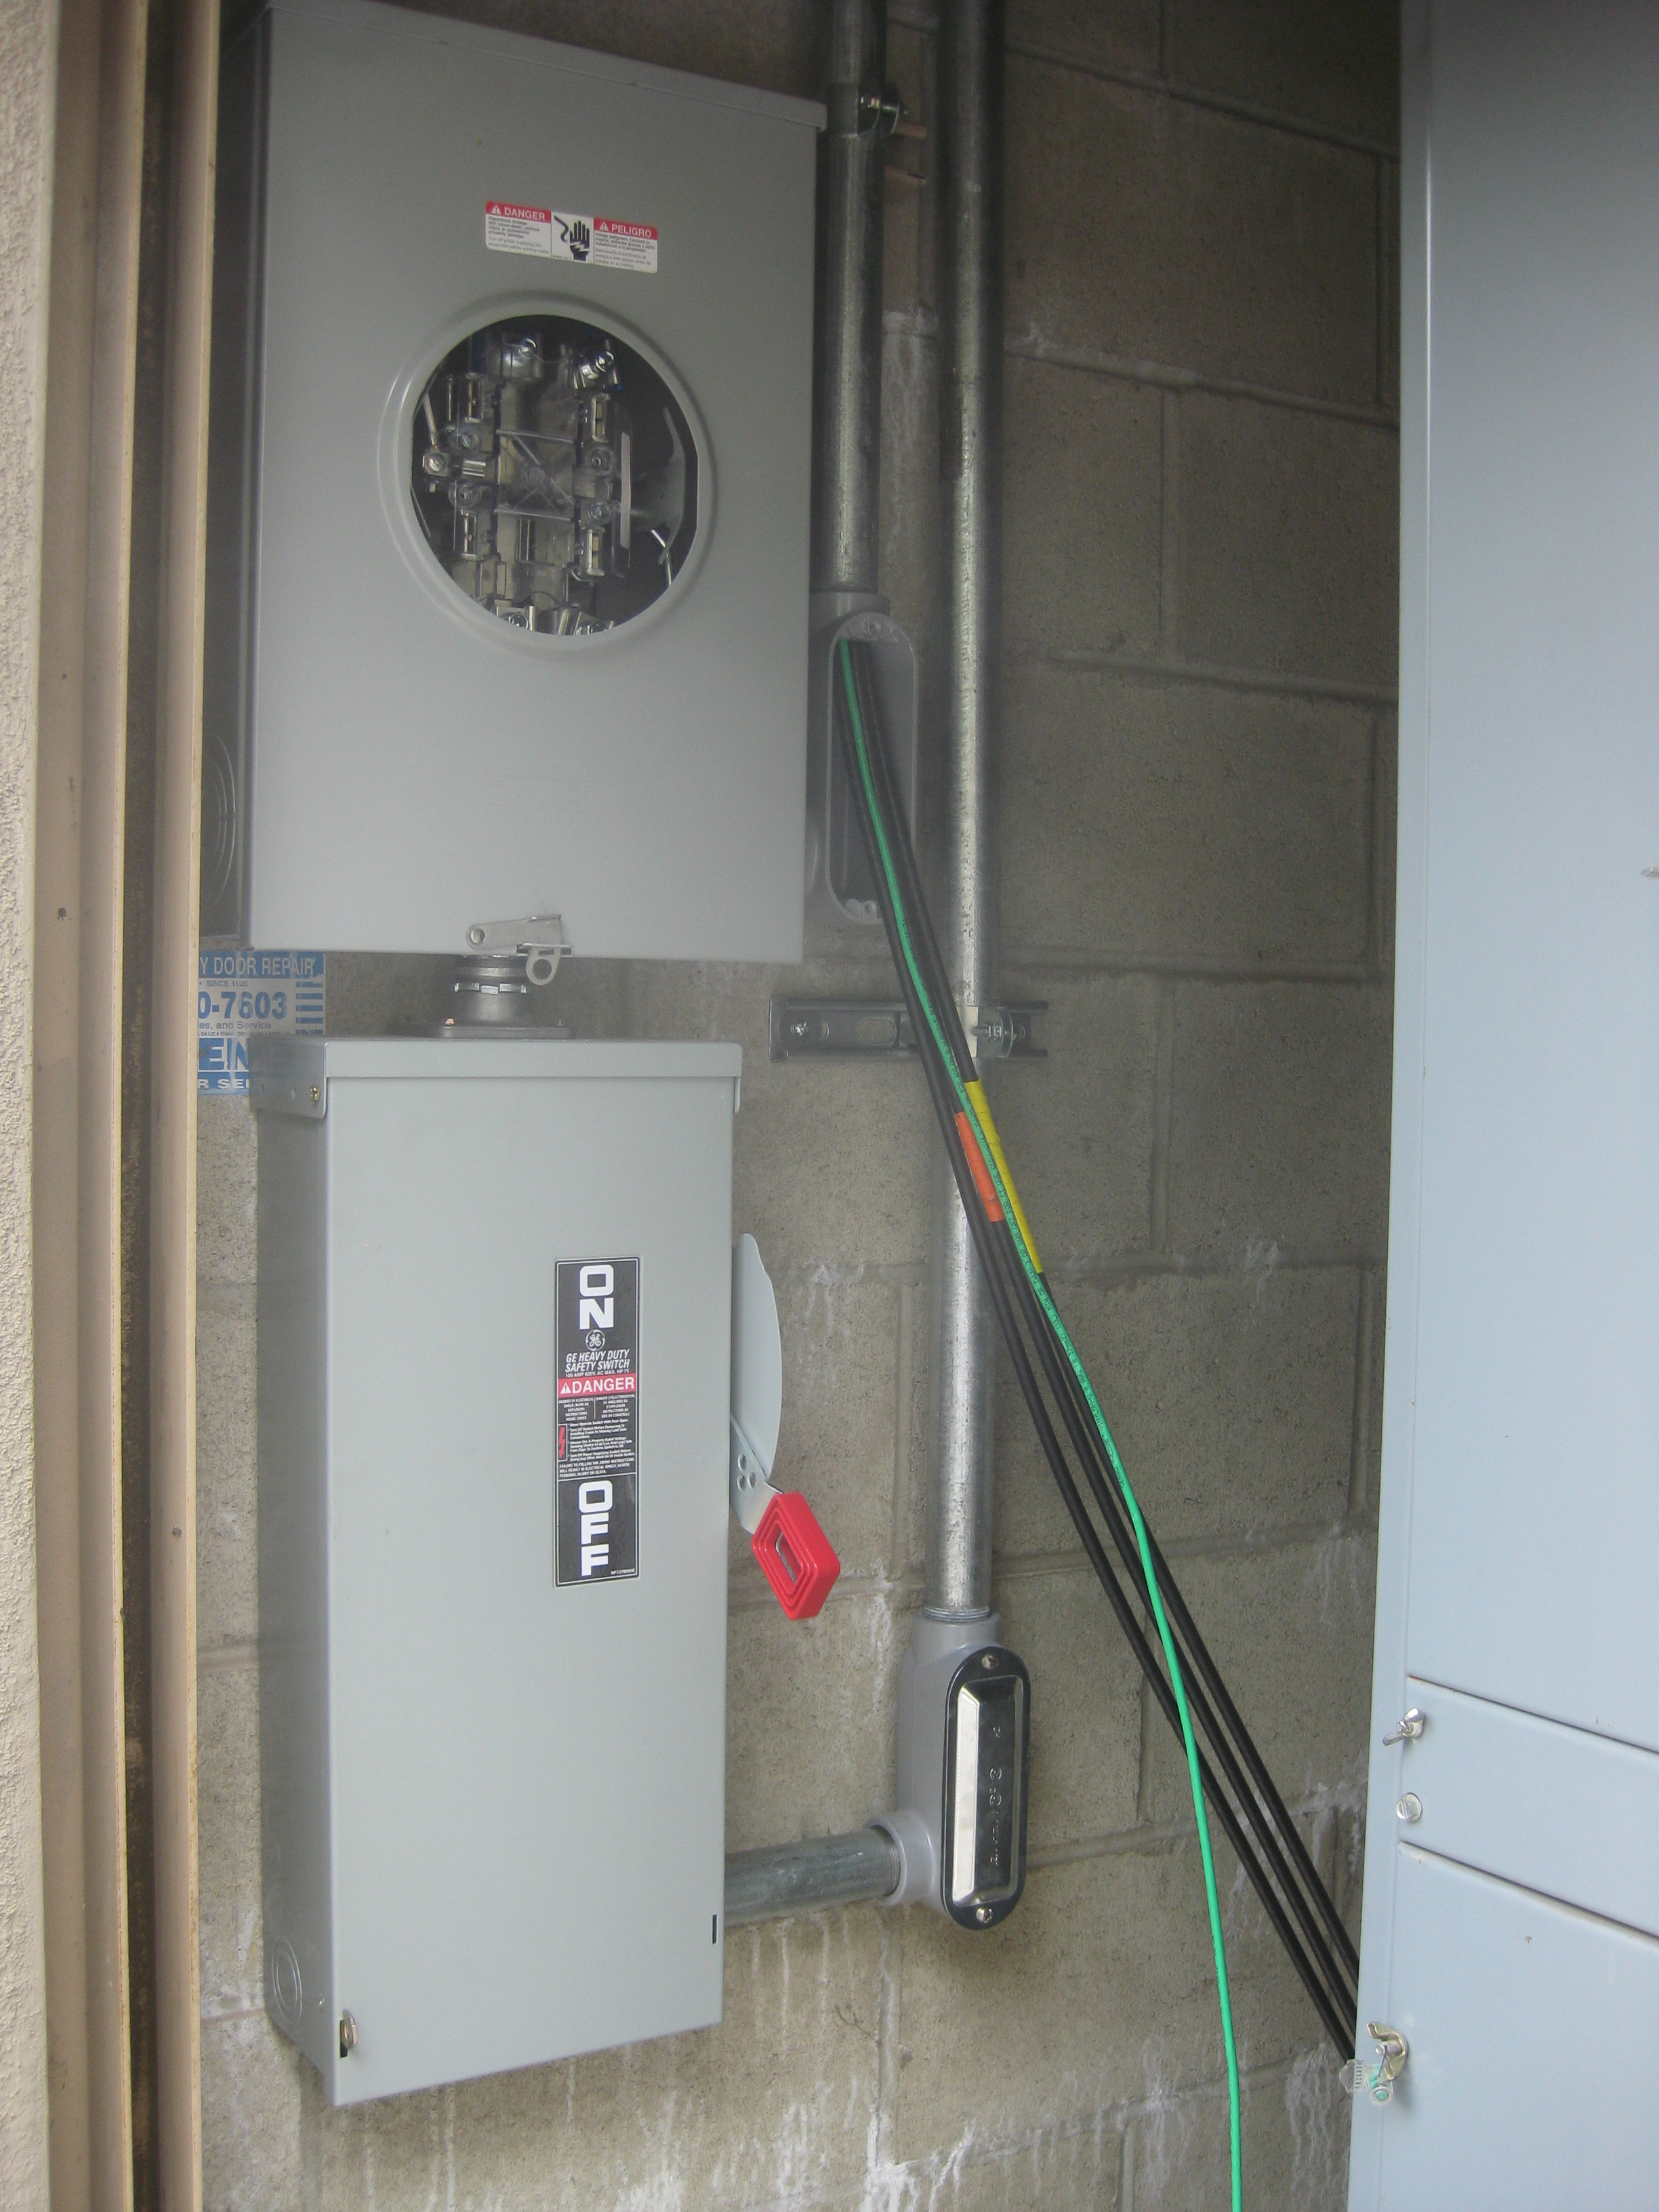
The Art of Conduit
In addition to our transformer, there were several other pieces of gear that had to be mounted on the ground including a 200 Amp sub-panel, two disconnect switches and a performance meter. Linking them all together is the conduit through which our conductors would be pulled.
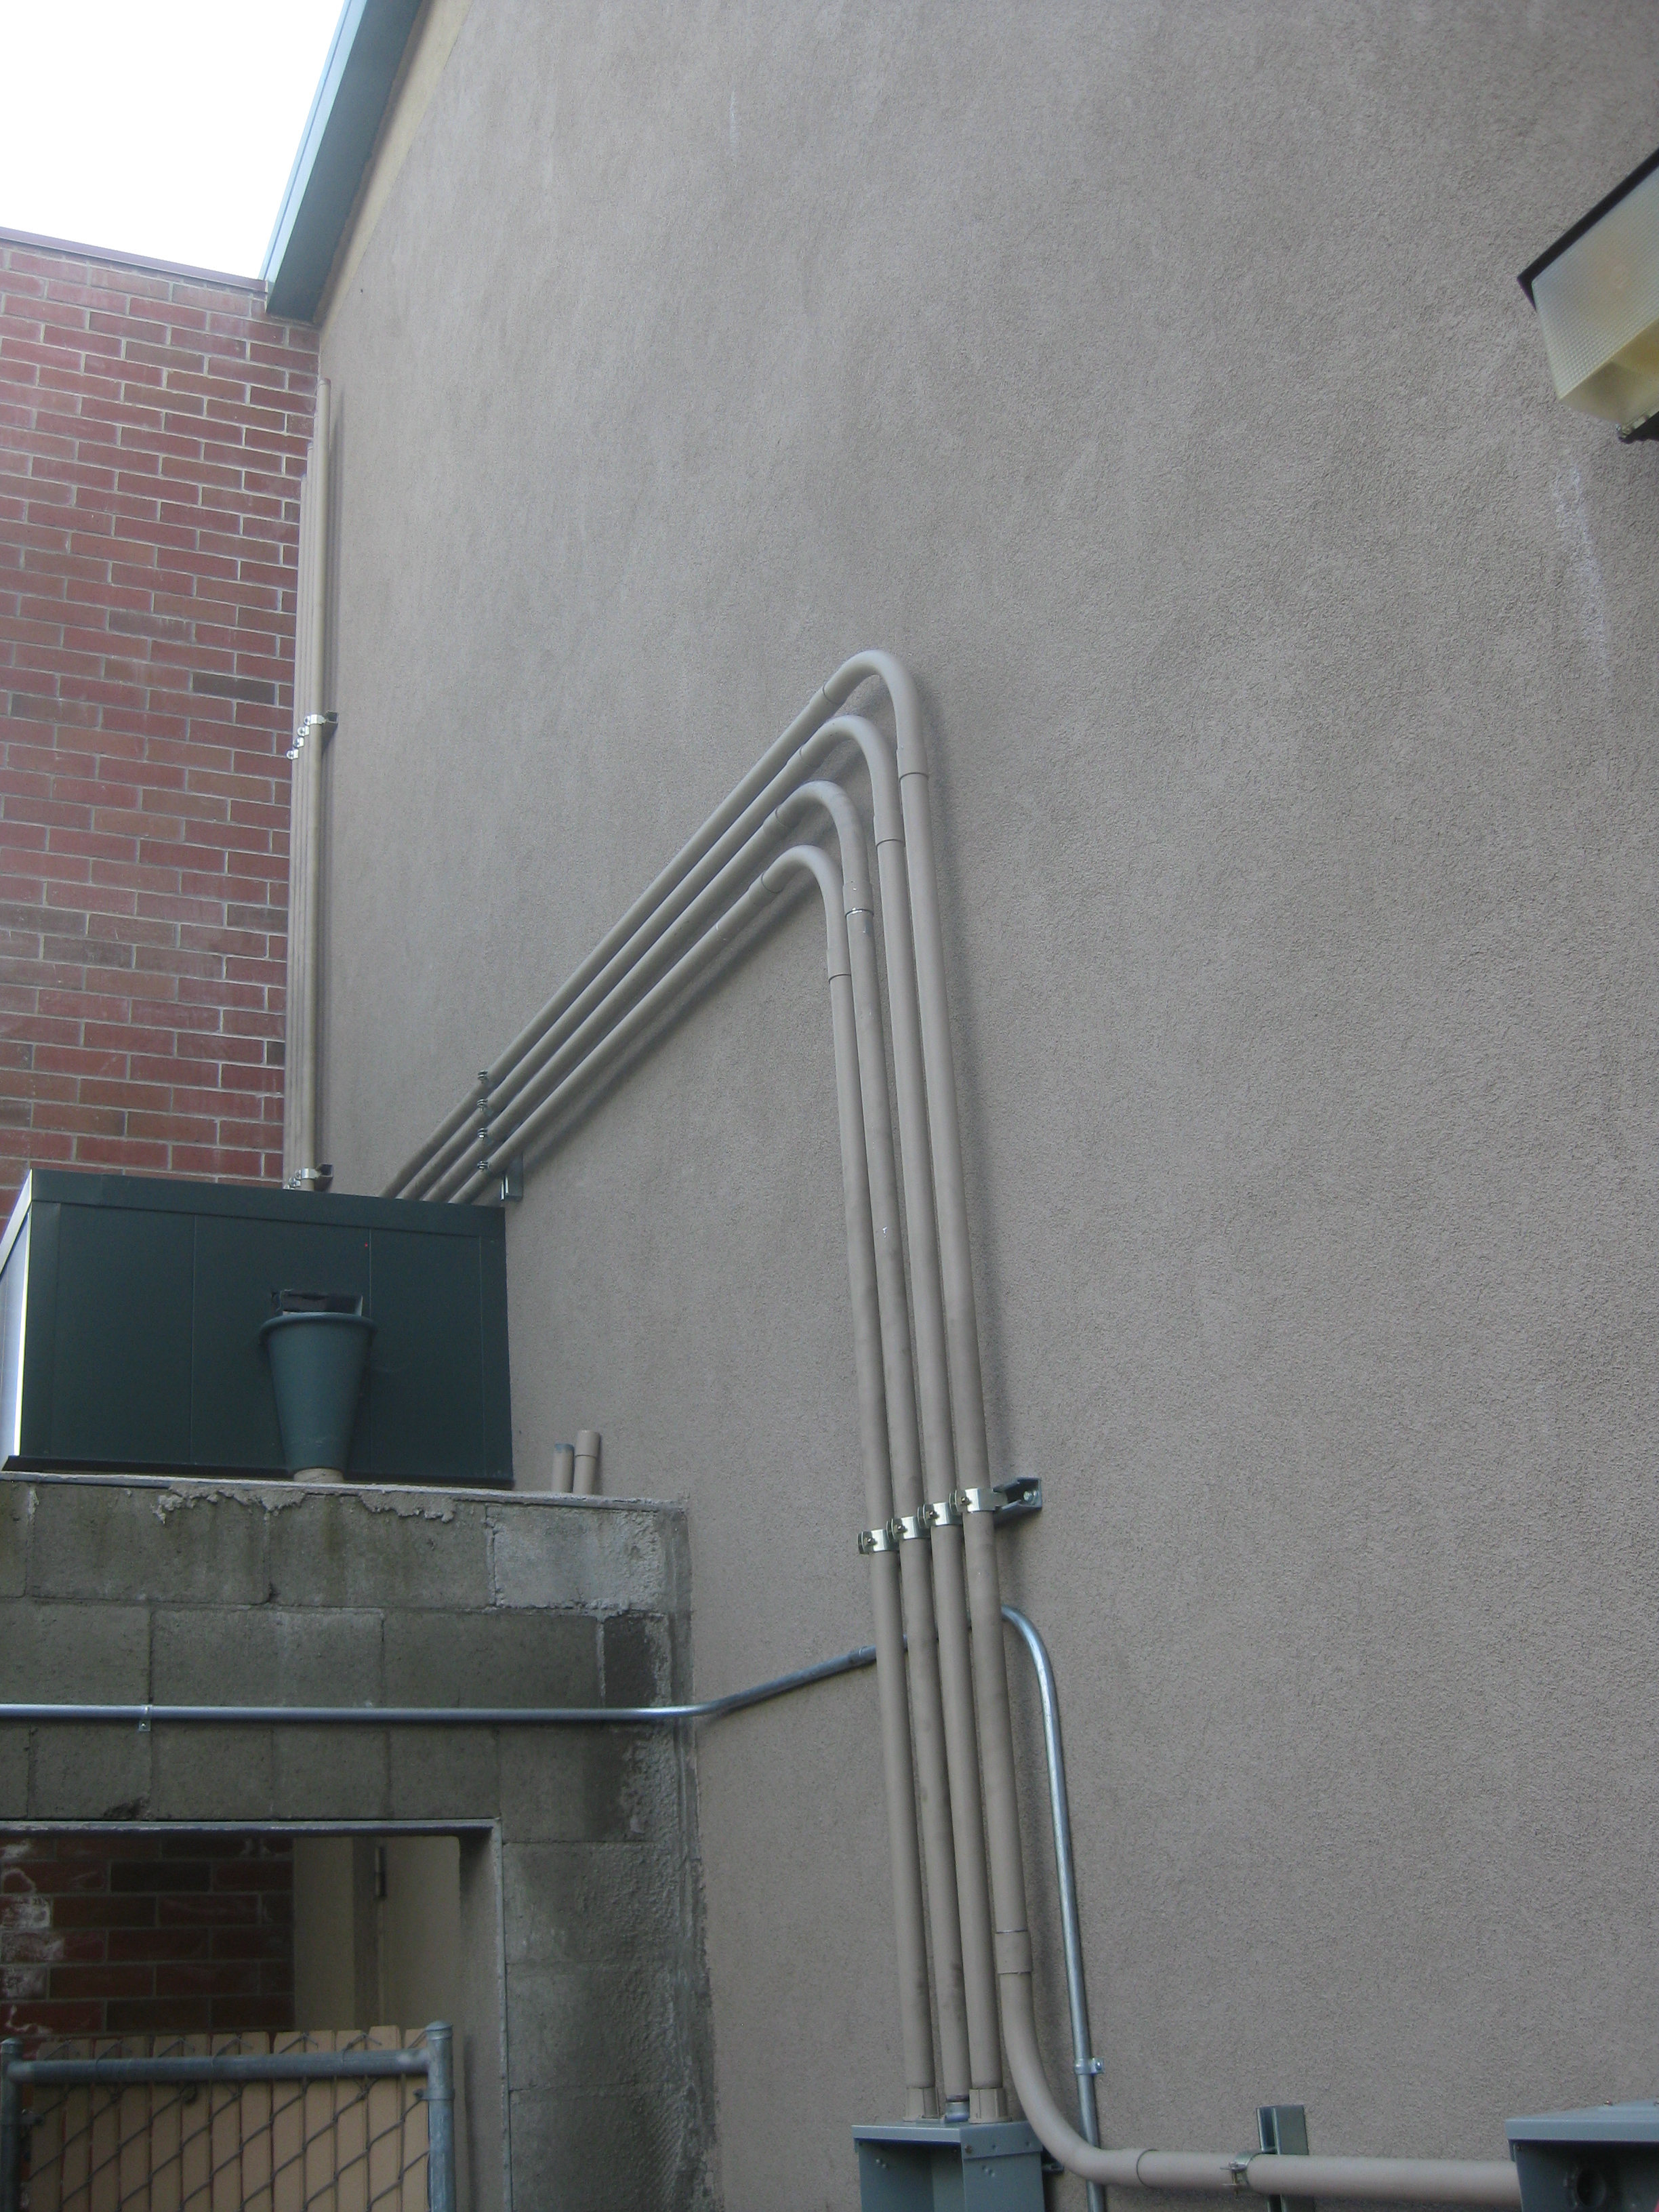 Pasadena requires rigid metal conduit (instead of EMT) to be used for solar power systems wherever it is accessible on the outside of a building. That offers some additional safety, but it comes at a cost - especially given that we were using 1.25″ conduit for most of our runs. Rigid conduit of that dimension is heavy and cannot be bent by hand. Instead, a motorized pipe bender was the order of the day - and it took some really skilled craftsman named Don and Josh to get our conduit in place and looking good.
It really is an art, as much as a science, and when done with care and precision, the result is quite appealing!
Pulling it Together
Our final ground-based task was to pull the conductors through the conduits. Our longest pull was 245′ - not quite a football field, but close! Moreover, that longest pull had multiple bends as we routed the conduit to make it as invisible from the ground as possible. (To complete the task of making the conduit “disappear” to the greatest extent possible, the client painted the conduit to match the walls and the trim!)
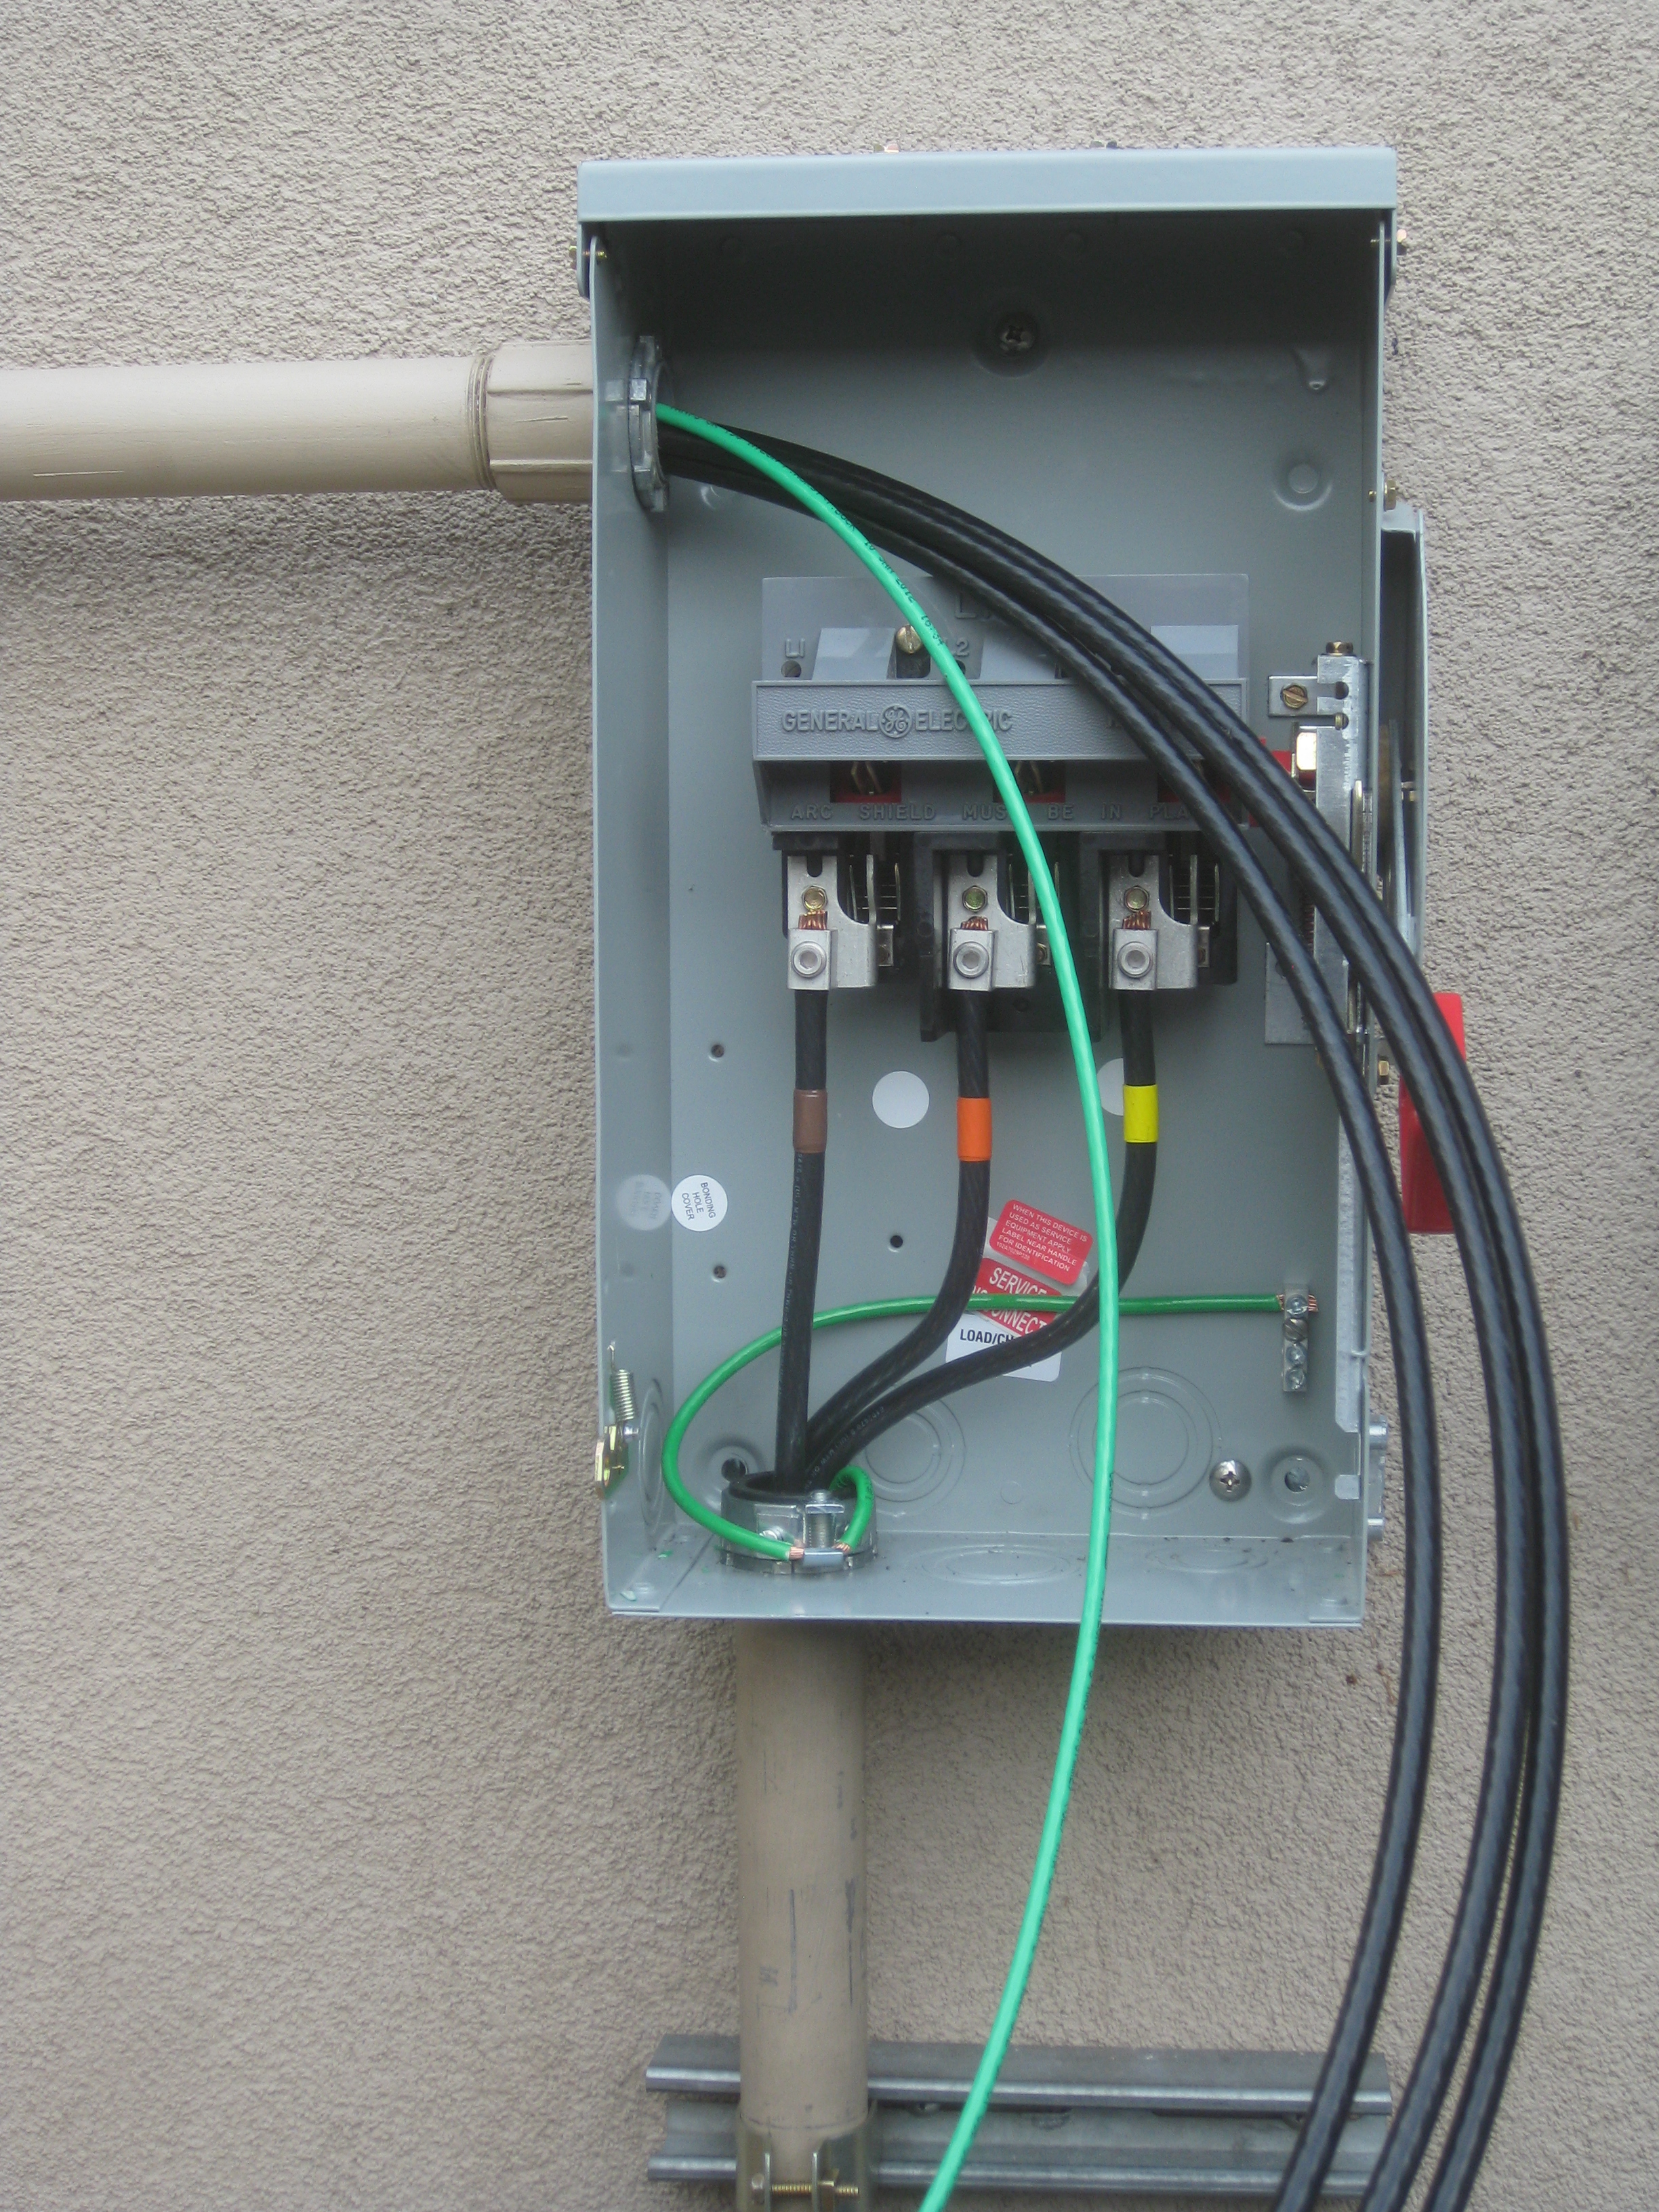
At the end of a very long, drizzly Saturday, we were rewarded with having our conductors fully in place from the utility disconnect switch and performance meter socket:
… to our disconnect switch adjacent to the transformer:
Our penultimate installment will take you to the roof where the real action takes place. So buckle in, the next chapter isn’t for the faint of heart!