Welcome to the
Run on Sun Monthly Newsletter

In this Issue: |
May, 2020
Volume: 11 Issue: 5
SCE Hikes Rates 6%Talk about tone deaf - just as folks are stuck at home, sheltering in place, SCE jacked its rates roughly 6% across the board, because, you know, folks can so much more easily afford a rate hike while people are losing their jobs! Here's our (can you say outraged) take... As of April 13, with little to no fanfare, SCE's latest rate increase went into effect. While different rates vary by somewhat different amounts, the overall average of 6.7% is expected to provide SCE with an additional $478 million dollars in revenue. How nice. The rate increase is not new; it is part of the CPUC-approved General Rate Case that was adopted in 2018 and covers rates for three years. Nevertheless, at a time when other utilities, like PWP, are working hard to support their customers during a disastrous financial time, SCE's willingness to press ahead with the rate increase is baffling, at best. Using our regular proposal tool - Energy Toolbase - we decided to look at the results for three actual clients: a small usage client, a medium or really typical client, and then a very large usage client to see how the percentages played out. Here are our results:
The small user, with a total annual usage of 6,093 kWh (16.7 kWh/day) still has an annual bill on the tiered, Domestic rate plan of $1,267 and will experience a 6.24% increase or an extra $79 out of pocket. Our medium user consumes nearly twice as much annual energy, 11,814 kWh (32.4 kWh/day), but because of the higher costs in the upper tiers of the Domestic rate plan, their bill is more than double. After the 6.24% increase, the medium user is spending an extra $166. Our large user - and this is not our largest residential client! - consumes 32,488 kWh (89.0 kWh/day), and has a bill to match, roughly four-times that of the medium user due to essentially living in the top tier of the rate structure. After a 6.26% increase, they will be spending an extra $633! We also looked at the same users switched over to a Time-of-Use rate (here, the 4-9 p.m. peak rate structure) and ran the numbers again. One thing that leaps right out at you is that very large users will do much better on a TOU rate generally since otherwise almost all of their usage is billed in the top tier. The percentage rate increases under the TOU rate are slightly smaller, with the small user paying an extra $76, the medium user $160, and the large user $507. Not exactly the sort of relief that ratepayers need at this time of unprecedented uncertainty. |
“Not exactly the sort of relief that ratepayers need at this time of unprecedented uncertainty…”
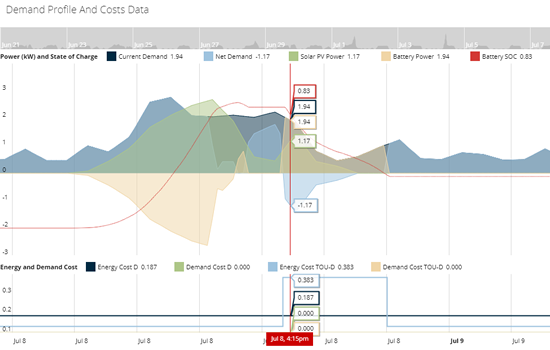
New Rule in SCE Territory Makes Solar + Storage More ValuableWe just learned from our friends at Energy Toolbase that Southern California Edison has just changed a rule about how solar PV systems with Energy Storage can operate, and the result - amazingly enough - results in greater savings for our clients! Imagine that?!? Here's our take... It used to be in SCE territory that when you added a storage system to your PV array, you could not export energy from the storage system to the grid and receive net metering credit. That meant that when the storage system was discharging, it could not exceed what the home's loads were demanding. If your usage in the evening was low, or say you were out of town, your fully charged battery could not discharge at all - a poor utilization of that expensive storage system. But now SCE - along with the other IOU's, PG&E and SDG&E - have changed their rules to allow storage systems to discharge back to the grid and receive full net metering credit for that energy, as long as the storage system is solely charged by the PV array. When you combine that rule change with electricity rates that favor storage, such as SCE's TOU-D-Prime rate, the change in the rule can account for significant savings. To get a handle on how big a change this will be, we went back to the data that we have for a client who we will be installing a small PV array and a 10 kWh Ensemble storage system soon. (All of our data analysis and visualizations you see here were done using Energy Toolbase, simply the best presentation tool on the market.) Solar PV & Storage - No Net Metering DischargeOur client with the small, 4.6 kW, PV system and 10 kWh Ensemble storage system has a system payback of 11.4 years. (Larger systems would have a faster payback.) For this analysis, we imported his SCE interval usage data (provided by UtilityAPI) into Energy Toolbase. ET then takes the performance output from the PV system, the charge and discharge parameters of the storage system, and overlays that on the existing usage - doing that calculation over every fifteen minute interval for a year. The graph below shows one day, July 8th, as a representative sample. Let's break this down:
There's a lot going on in this image (click on it for a larger version). The dark gray is the historical usage demand based on the SCE data. The value is shown at the top as "Current Demand" and at the moment we have focused on - July 8 at 4:15 p.m. - the historical demand was 1.94 kW. The green curve shows the modeled PV array output, using the specific parameters for this site - azimuth, tilt, shading, historical weather, specific equipment being used - as determined by NREL's PVWatts tool (version 5). Right now it is at 1.17 kW. The red line shows the percentage state of charge for the storage system, at this moment it is 83%. Net Demand is what is being imported (positive number) or exported (negative number) to the grid. Finally, Battery Power is how much power is being pulled from the storage system which at this moment is 1.94 kW. At the bottom is the cost parameters for this rate schedule. Under the pre-solar Domestic rate (which is a tiered rate) the cost of energy is 18.7 cents/kWh, whereas under the new rate structure it is more than twice that at 38.3 cents during the peak, 4-9 p.m. period. So... earlier in the day, as the output from the PV increases, and energy charges are cheap, the solar charges the battery for use later when the rates are high. As we cross over into the peak rate period at 4:00, the storage system begins to discharge and its output is exactly the same as the demand, meaning that all of the power from the PV system can be exported to the grid. But note that the battery power is only 1.94 kW, even though its continuous peak output is roughly twice that, 3.84 kW. Under the old rules though, the storage system cannot output more than that, since it is barred from exporting to the grid. As a result, when the peak rate period ends at 9:00 p.m. the storage system shuts off, even though it is still partially charged (nearly 40% capacity remains in this example). That's leaving money on the table! Solar PV & Storage - Net Metering Discharge AllowedConsider the same day, only now we can export the full output of the storage system as desired to maximize our time-of-use arbitrage.
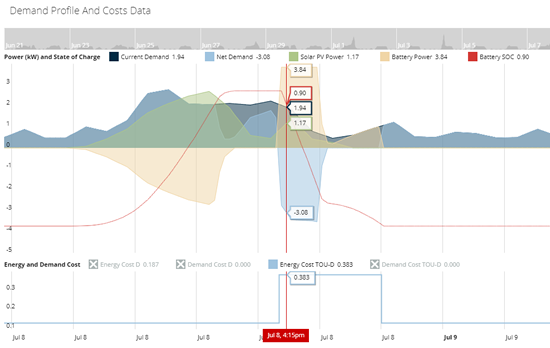
Everything is essentially the same until we get to 4:00 p.m. and then things get very different! Look at the difference in the output from the battery system, it is now putting out it's maximum sustained power of 3.84 kW, resulting in more than 3 kW being exported during the peak price period More importantly from an arbitrage perspective, the storage system is completely cycled. Meaning that we have gotten full utilization from our storage system investment. What does that mean overall economically? Payback is reduced from 11.4 to 10.7 years, a 6.1% improvement. Gee, thanks, SCE! So why are they doing this? Simple: grid support. Having storage systems maximizing their output during the peak demand period (remember the Duck Curve?) helps the utility to manage its load, and reduce the need for expensive peaker capacity. Everybody benefits: our client (with faster payback), the utility (with better grid load management), and even non-solar/storage rate payers (as they don't have to pay for that additional production capacity. Win, win, win! Of course, these economic benefits don't really apply to a tiered rate structure, such as is used for residential rates in PWP territory. But if you are in SCE territory, adding smart storage, like the Enphase Ensemble system, just became a lot more lucrative. |
We're Back in the Business of Space!At a time when the world seems pretty grim, we got a much needed dose of good news yesterday when the brilliant teams at SpaceX and NASA got the United States back in the business of launching astronauts into space from a US rocket, launched on US soil. The completely "nominal" launch of the Falcon 9/Dragon Commercial Crew Vehicle on Saturday, May 30, 2020 ended a draught of nine long years. This is easily today's Best New Thing in the World - bravo! 
SpaceX Falcon 9 rocket propels Dragon capsule into space, May 30, 2020 at 15:22 EDT with |


